Remove Dashboards Remove Data Collection Remove Key Performance Indicator Remove Software
article thumbnail

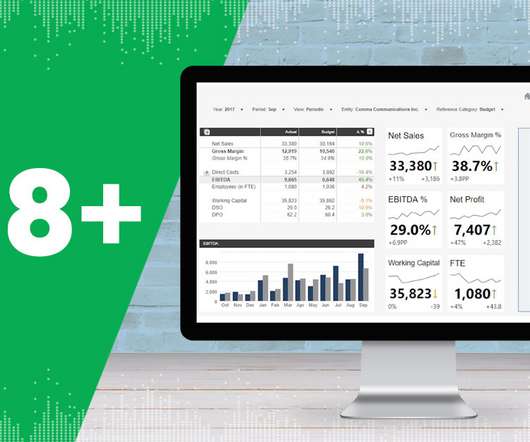
Financial Dashboard: Definition, Examples, and How-tos

FineReport

In today’s dynamic business environment, gaining comprehensive visibility into financial data is crucial for making informed decisions. This is where the significance of a financial dashboard shines through. What is A Financial Dashboard? You can download FineReport for free and have a try!

article thumbnail

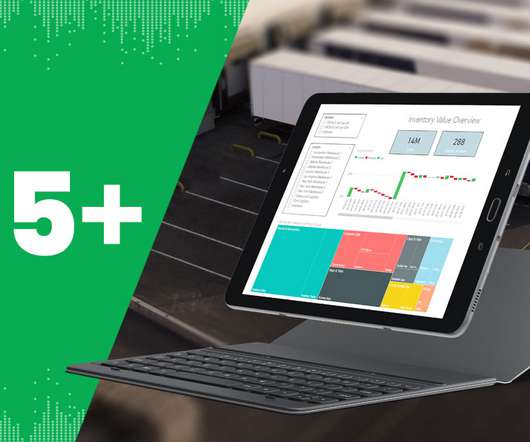
Digital Dashboard: Make You Prosper In Digital Era

FineReport

Are you still using the traditional cumbersome and redundant data collection methods? Have you ever neglected key indicators because of irrelevant data in your decision-making? No need to be worried anymore, all these management problems could be settled with digital dashboard. Digital dashboard software.

Insiders

Sign Up for our Newsletter

This site is protected by reCAPTCHA and the Google Privacy Policy and Terms of Service apply.

article thumbnail

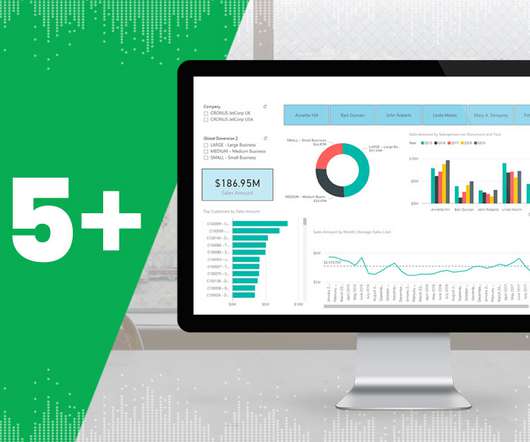
Everything You Need to Know About Project Management Dashboard

FineReport

Thus, one tool that has gained significant popularity in recent years is the Project Management Dashboard. Moreover, the implementation of an effective Project Management Dashboard facilitates data-driven decision-making and sustainable business success. What Is A Project Management Dashboard?

article thumbnail

30 Best Manufacturing KPIs and Metric Examples for 2021 Reporting

Jet Global

An Operations Key Performance Indicator (KPI) or metric is a discrete measurement that a company uses to monitor and evaluate the efficiency of its day-to-day operations. Leading companies make use of KPIs and KPI dashboards to measure their efficiency in real time. Manufacturing Operational Key Performance Indicators.

Metrics 131
article thumbnail

A Guide To The Methods, Benefits & Problems of The Interpretation of Data

datapine

2) How To Interpret Data? 3) Why Data Interpretation Is Important? 4) Data Analysis & Interpretation Problems. 5) Data Interpretation Techniques & Methods. 6) The Use of Dashboards For Data Interpretation. Business dashboards are the digital age tools for big data. What is the keyword?

article thumbnail

28 Best Insurance KPIs and Metrics Examples for 2020 Reporting

Jet Global

An insurance Key Performance Indicator (KPI) or metric is a measure that an insurance company uses to monitor its performance and efficiency. How to Build Useful KPI Dashboards. How to Develop a Key Performance Indicator for an Insurance Company. What Is an Insurance KPI? View Guide Now.

article thumbnail

Two Downs Make Two Ups: The Only Success Metrics That Matter For Your Data & Analytics Team

DataKitchen

Under Quality, the Data Quality Incidents metric measures the average data quality of datasets, while the Active Daily Users metric measures user activity across data platforms. Other data leaders have tried to adapt the IT/software incident metrics world to the data world. Data systems require trust.

Metrics 130