Remove Dashboards Remove Data-driven Remove Reporting Remove ROI
article thumbnail

Your Guide To Modern Agency Analytics, Dashboards & Reporting Techniques

datapine

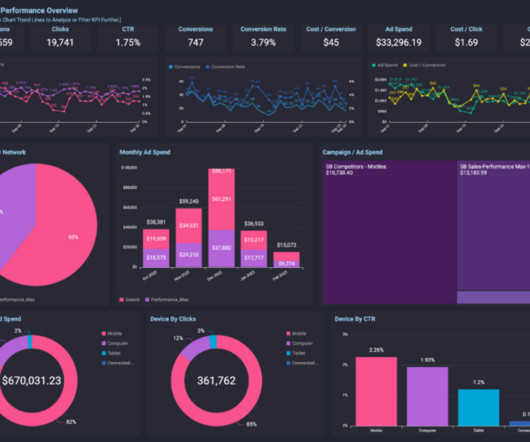
The answer is modern agency analytics reports and interactive dashboards. Starting with its definition, following with the benefits of agency reports, a list of tools, and a set of agency dashboard examples. We will then finish with 8 valuable tips to achieve a successful agency reporting process.

article thumbnail

Move Beyond Excel, PowerPoint And Static Business Reporting with Powerful Interactive Dashboards

datapine

Soon businesses of all sizes will have so much amount of information that dashboard software will be the most invaluable resource a company can have. Visualizing the data and interacting on a single screen is no longer a luxury but a business necessity. That’s why we welcome you to the world of interactive dashboards.
Insiders

Sign Up for our Newsletter

This site is protected by reCAPTCHA and the Google Privacy Policy and Terms of Service apply.

Trending Sources

article thumbnail

Utilize The Effectiveness Of Professional Executive Dashboards & Reports

datapine

Without big data analytics, companies are blind and deaf, wandering out onto the Web like deer on a freeway. We are indeed living in a time rich in invaluable digital data. Exclusive Bonus Content: Executive Dashboards & Reports: A Summary. What Is Executive Dashboard Reporting?

article thumbnail

Top 10 Management Reporting Best Practices To Create Effective Reports

datapine

Management reporting is a source of business intelligence that helps business leaders make more accurate, data-driven decisions. But, these reports are only as useful as the work that goes into preparing and presenting them. Exclusive Bonus Content: Get our free guide to creating better reports! They’re also slow.

Reporting 263
article thumbnail

Monetizing Analytics Features: Why Data Visualizations Will Never Be Enough

Think your customers will pay more for data visualizations in your application? But today, dashboards and visualizations have become table stakes. Discover which features will differentiate your application and maximize the ROI of your embedded analytics. Five years ago they may have. Brought to you by Logi Analytics.

article thumbnail

The Ultimate Guide to Modern Data Quality Management (DQM) For An Effective Data Quality Control Driven by The Right Metrics

datapine

1) What Is Data Quality Management? 4) Data Quality Best Practices. 5) How Do You Measure Data Quality? 6) Data Quality Metrics Examples. 7) Data Quality Control: Use Case. 8) The Consequences Of Bad Data Quality. 9) 3 Sources Of Low-Quality Data. 10) Data Quality Solutions: Key Attributes.

article thumbnail

Mastering BI Dashboard Tools: Your Essential Guide

FineReport

In today’s data-driven landscape, businesses are leaning more on BI tools , particularly BI dashboard solutions, to enhance decision-making through data visualization. These BI Dashboard tools blend advanced analytics with user-friendly interfaces, revealing invaluable insights.