Remove Dashboards Remove Data Quality Remove Data Warehouse Remove Visualization
article thumbnail

Visualize data quality scores and metrics generated by AWS Glue Data Quality

AWS Big Data

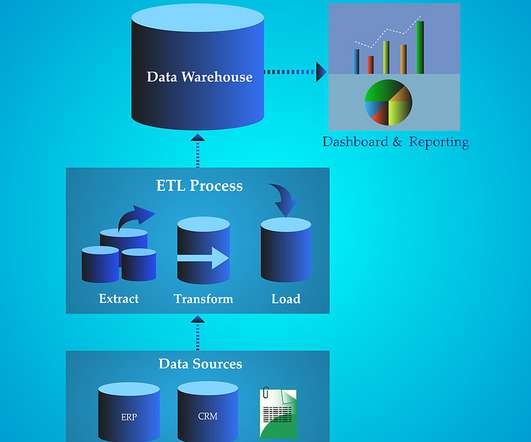
AWS Glue Data Quality allows you to measure and monitor the quality of data in your data repositories. It’s important for business users to be able to see quality scores and metrics to make confident business decisions and debug data quality issues. An AWS Glue crawler crawls the results.

article thumbnail

The Ultimate Guide to Modern Data Quality Management (DQM) For An Effective Data Quality Control Driven by The Right Metrics

datapine

1) What Is Data Quality Management? 4) Data Quality Best Practices. 5) How Do You Measure Data Quality? 6) Data Quality Metrics Examples. 7) Data Quality Control: Use Case. 8) The Consequences Of Bad Data Quality. 9) 3 Sources Of Low-Quality Data.

Insiders

Sign Up for our Newsletter

This site is protected by reCAPTCHA and the Google Privacy Policy and Terms of Service apply.

article thumbnail

Financial Dashboard: Definition, Examples, and How-tos

FineReport

In today’s dynamic business environment, gaining comprehensive visibility into financial data is crucial for making informed decisions. This is where the significance of a financial dashboard shines through. What is A Financial Dashboard? You can download FineReport for free and have a try! Free Download of FineReport 1.

article thumbnail

Accelerate analytics on Amazon OpenSearch Service with AWS Glue through its native connector

AWS Big Data

As the volume and complexity of analytics workloads continue to grow, customers are looking for more efficient and cost-effective ways to ingest and analyse data. AWS Glue provides both visual and code-based interfaces to make data integration effortless. Choose the link under OpenSearch Dashboards URL.

Analytics 100
article thumbnail

Common Business Intelligence Challenges Facing Entrepreneurs

datapine

In addition to increasing the price of deployment, setting up these data warehouses and processors also impacted expensive IT labor resources. Check out this investor relations dashboard example below, part of our management dashboard series: **click to enlarge**. They also need these tools to generate a true ROI.

article thumbnail

6 strategic imperatives for your next data strategy

CIO Business Intelligence

The focus here should be on considering all ways your customers currently consume data as well as new ways they might want to achieve better results. Of course, no set of imperatives for a data strategy would be complete without the need to consider people, process, and technology.

article thumbnail

Your Data Won’t Speak Unless You Ask It The Right Data Analysis Questions

datapine

This can include a multitude of processes, like data profiling, data quality management, or data cleaning, but we will focus on tips and questions to ask when analyzing data to gain the most cost-effective solution for an effective business strategy. If nothing can be changed, there is no point of analyzing data.

IT 317