article thumbnail

Mastering Data Analysis Report and Dashboard

FineReport

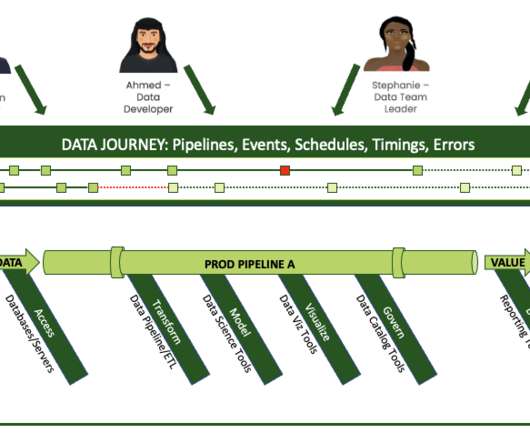
As we explore examples of data analysis reports and interactive report data analysis dashboards, we embark on a journey to unravel the nuanced art of transforming raw data into meaningful narratives that empower decision-makers. Try FineReport Now 1. Try FineReport Now 1.1

article thumbnail

Building Data Visualization Expertise for Your Business  

InsightOut

In this data-driven world, building a team of data analysts can be a challenge. Implementing data visualization and analytics dashboards can be the beginning of the data transformation journey.

Insiders

Sign Up for our Newsletter

This site is protected by reCAPTCHA and the Google Privacy Policy and Terms of Service apply.

article thumbnail

How HR&A uses Amazon Redshift spatial analytics on Amazon Redshift Serverless to measure digital equity in states across the US

AWS Big Data

HR&A has used Amazon Redshift Serverless and CARTO to process survey findings more efficiently and create custom interactive dashboards to facilitate understanding of the results. This frees up our local computer space, greatly automates the survey cleaning and analysis step, and allows our clients to easily access the data results.

article thumbnail

10 Examples of How Big Data in Logistics Can Transform The Supply Chain

datapine

Benefits Of Big Data In Logistics Before we look at our selection of practical examples and applications, let’s look at the benefits of big data in logistics – starting with the (not so) small matter of costs. Use our 14-days free trial today & transform your supply chain! Now’s the time to strike.

Big Data 275
article thumbnail

Accelerate analytics on Amazon OpenSearch Service with AWS Glue through its native connector

AWS Big Data

AWS Glue is a serverless data integration service that makes it straightforward to discover, prepare, and combine data for analytics, machine learning (ML), and application development. AWS Glue provides both visual and code-based interfaces to make data integration effortless. Choose Create job and Visual ETL.

article thumbnail

The Ultimate Guide to Modern Data Quality Management (DQM) For An Effective Data Quality Control Driven by The Right Metrics

datapine

He/she assists the organization by providing clarity and insight into advanced data technology solutions. As quality issues are often highlighted with the use of dashboard software , the change manager plays an important role in the visualization of data quality. date, month, and year).

article thumbnail

Advanced reporting and analytics for the Post Call Analytics (PCA) solution with Amazon QuickSight

AWS Big Data

You can visualize the PCA insights in the business intelligence (BI) tool Amazon QuickSight for advanced analysis. In this post, we show you how to use PCA’s data to build automated QuickSight dashboards for advanced analytics to assist in quality assurance (QA) and quality management (QM) processes.