Remove Dashboards Remove Events Remove Key Performance Indicator Remove Metrics
article thumbnail

Monitoring Cloudera DataFlow Deployments With Prometheus and Grafana

Cloudera

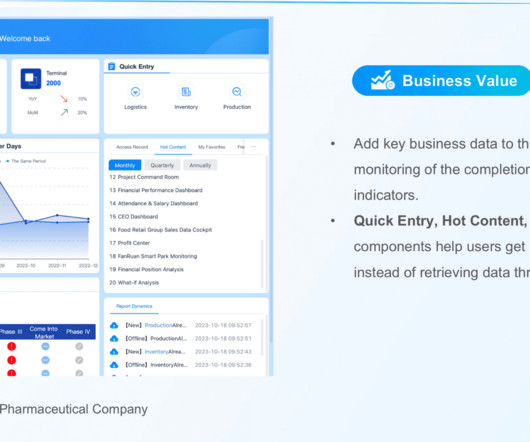
It allows developers to interactively design data flows in a drag and drop designer, which can be deployed as continuously running, auto-scaling flow deployments or event-driven serverless functions. CDF-PC comes with a monitoring dashboard out of the box for data flow health and performance monitoring.

Metrics 102
article thumbnail

How To Improve Your Facility Management With Healthcare Reports

datapine

Like many of today’s most important industries, digital data, metrics and KPIs (key performance indicators) are a part of a bright and prosperous future – and a comprehensive healthcare report has the power to deliver in each of these critical areas. The Benefits Of A Healthcare Report. Preventative management.

Reporting 198
Insiders

Sign Up for our Newsletter

This site is protected by reCAPTCHA and the Google Privacy Policy and Terms of Service apply.

article thumbnail

How to achieve Kubernetes observability: Principles and best practices

IBM Big Data Hub

Observability comprises a range of processes and metrics that help teams gain actionable insights into a system’s internal state by examining system outputs. The primary data classes used—known as the three pillars of observability—are logs, metrics and traces.

Metrics 72
article thumbnail

Combine transactional, streaming, and third-party data on Amazon Redshift for financial services

AWS Big Data

You can run a direct query from QuickSight for BI reporting and dashboards. You can use Amazon Managed Grafana for near-real-time trade dashboards that are refreshed every few seconds. Historical quotes analysis In this section, we explore some examples of historical quotes analysis from the Amazon QuickSight dashboard.

article thumbnail

Discover The Power Of Modern Performance Reports – See Examples & Best Practices 

datapine

To help you get started with the topic, we put together this insightful guide on modern performance reporting using professional online dashboards. Keep reading to find a definition, benefits, examples, and some key best practices to generate them successfully! What Is A Performance Report?

Reporting 207
article thumbnail

The Power Of Real Time Analytics & Business Intelligence Explained

datapine

But, while data offers us invaluable insight in more ways than one, with so much to analyze and such little time, it’s becoming increasingly difficult to understand which metrics offer real value. Usually the process is done through a BI dashboard software that helps users directly interact with the data and generate insights instantaneously.

article thumbnail

Exploring real-time streaming for generative AI Applications

AWS Big Data

Another example is an AI-driven observability and monitoring solution where FMs monitor real-time internal metrics of a system and produces alerts. When the model finds an anomaly or abnormal metric value, it should immediately produce an alert and notify the operator. Streaming storage provides reliable storage for streaming data.