Remove Dashboards Remove Metrics Remove Modeling Remove Visualization
article thumbnail

Customer Retention Dashboard & Metrics Examples For Modern Companies

datapine

A customer retention dashboard and metrics depicted in a neat visual will help you in monitoring, analyzing, and managing multiple customer-centric points and how they echo in your business. Your Chance: Want to build a dashboard for customer retention? Try our professional dashboard software for 14 days, completely free!

article thumbnail

Remove Your Rose Tinted Glasses: Data Visualizations Designed to Mislead

datapine

1) Misleading Data Visualization Examples. 2) How to Avoid Misleading Visuals. 3) The Impact Of Bad Data Visualizations. But while that may be the case, people are duped by data visualizations every day. Bad data visualizations come in many forms, with some more obvious than others. Table of Contents.

Insiders

Sign Up for our Newsletter

This site is protected by reCAPTCHA and the Google Privacy Policy and Terms of Service apply.

article thumbnail

Take Advantage Of Operational Metrics & KPI Examples – A Comprehensive Guide

datapine

By establishing clear operational metrics and evaluate performance, companies have the advantage of using what is crucial to stay competitive in the market, and that’s data. Your Chance: Want to visualize & track operational metrics with ease? What Are Metrics And Why Are They Important?

KPI 269
article thumbnail

Enhance monitoring and debugging for AWS Glue jobs using new job observability metrics: Part 2

AWS Big Data

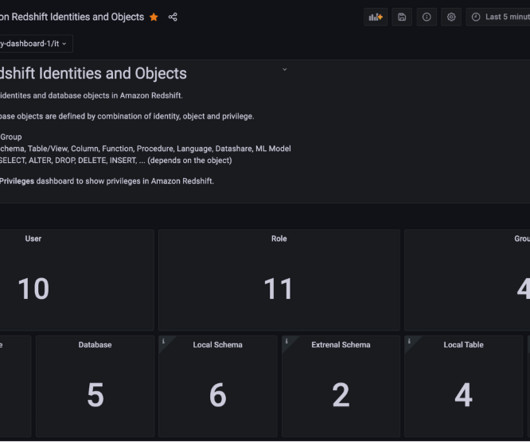
AWS Glue has made this more straightforward with the launch of AWS Glue job observability metrics , which provide valuable insights into your data integration pipelines built on AWS Glue. This post, walks through how to integrate AWS Glue job observability metrics with Grafana using Amazon Managed Grafana. Sign in to your workspace.

Metrics 103
article thumbnail

Mastering BI Dashboard Tools: Your Essential Guide

FineReport

In today’s data-driven landscape, businesses are leaning more on BI tools , particularly BI dashboard solutions, to enhance decision-making through data visualization. These BI Dashboard tools blend advanced analytics with user-friendly interfaces, revealing invaluable insights.

article thumbnail

Discover Powerful Small Business Dashboards & KPIs To Track For Success

datapine

1) What Is A Small Business Dashboard? 3) Why Do You Need Small Business Dashboards. 4) Small Business Dashboard & KPIs Examples. Enter small business dashboards and metrics. BI dashboard tools provide smaller businesses with valuable insights regarding their operations thanks to real-time access to data.

article thumbnail

SaaS Dashboard Examples For Modern Business Management Practices

datapine

That’s where SaaS dashboards enter the fold. A SaaS dashboard is a powerful business intelligence tool that offers a host of benefits for ambitious tech businesses. Exclusive Bonus Content: Your Definitive Guide to SaaS & Dashboards! Geet our bite-sized free summary and start building your dashboards!