Remove Data-driven Remove Magazine Remove Measurement Remove Reporting
article thumbnail

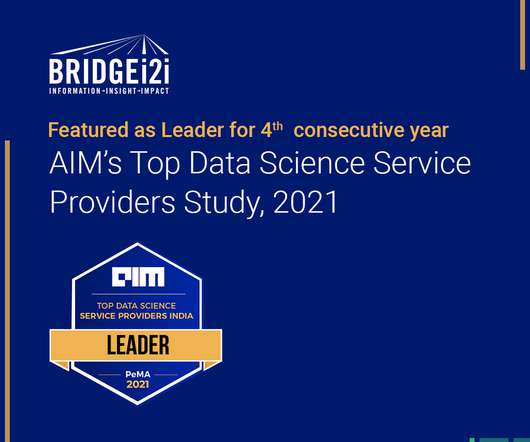
BRIDGEi2i Recognized as Leader in AIM’s Top Data Science Service Providers in India Report, 2021

bridgei2i

BRIDGEi2i Analytics Solutions, a trusted partner to enterprises globally, announced its inclusion in the ‘Leader’ category of the latest Penetration & Maturity Quadrant (PeMa) study conducted by Analytics India Magazine. To know more about the PeMa study, read the full report here. About BRIDGE i2i. Venkat Subramanian.

article thumbnail

See, Think, Do, Care Wining Combo: Content + Marketing + Measurement!

Occam's Razor

Remember, there was little data to know what worked – hence what might have worked in the past was repeated. Not just your largest addressable audience , that leads to the omni-present spray-and-pray advertising on TV and in magazines. We can talk about Content AND Marketing AND Measurement. and measurement (soon after!)

Insiders

Sign Up for our Newsletter

This site is protected by reCAPTCHA and the Google Privacy Policy and Terms of Service apply.

article thumbnail

Smart SMBs Are Taking Advantage of Major Advances in Data Security

Smart Data Collective

2020 was an especially eventful year for small businesses and it has exposed fundamental flaws in the way they handle data. Here are 4 ways SMBs can strengthen data security in 2021-. The failure to report a breach quickly adds up to downtime and revenue loss. System updates and data backups. Secure cloud infrastructure.

article thumbnail

BRIDGEi2i Named as LEADER in AIM’s Top Data Science Service Providers in India 2020

bridgei2i

BRIDGEi2i Analytics Solutions, a leading provider of AI-powered Analytics Solutions, announced that it had been recognized as a ‘LEADER’ among data service providers from a study by Analytics India Magazine(AIM). BRIDGEi2i receives this recognition for three consecutive years. Awards & Recognition News & Updates.

article thumbnail

Measuring Incrementality: Controlled Experiments to the Rescue!

Occam's Razor

This: You understand all the environmental variables currently in play, you carefully choose more than one group of "like type" subjects, you expose them to a different mix of media, measure differences in outcomes, prove / disprove your hypothesis (DO FACEBOOK NOW!!!), ask for a raise. It is that simple. Okay, it is not simple.

article thumbnail

Take Advantage Of The Top 16 Sales Graphs And Charts To Boost Your Business

datapine

The question and answer we included come from an actual interview that Fortune magazine did with billionaire Tilman Fertitta. Let’s examine how you can do so with the following sales KPIs, created for a comprehensive sales report. A revenue graph that is worth exploring on a monthly basis by utilizing a modern KPI reporting software.

Sales 235
article thumbnail

EU Cookie / Privacy Laws: Implications On Data Collection And Analysis

Occam's Razor

The way data is collected online and what happens to it is a much-scrutinized issue (and rightly so). Digital data collection is also exceedingly complex, perhaps a reflection of the organic nature, and subsequent explosion, of the internet. These server logs can then be used to do basic reporting using off the shelf software.