Remove Data-driven Remove Measurement Remove Metrics Remove Visualization
article thumbnail

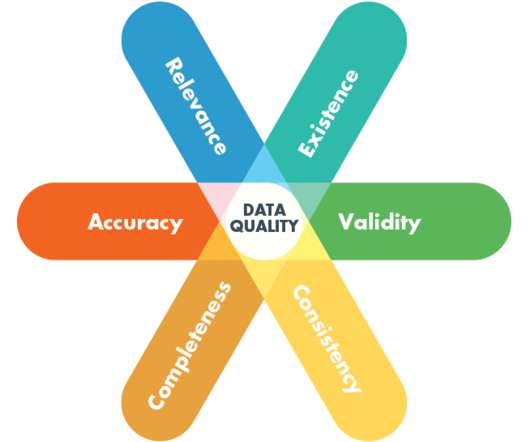
The Ultimate Guide to Modern Data Quality Management (DQM) For An Effective Data Quality Control Driven by The Right Metrics

datapine

1) What Is Data Quality Management? 4) Data Quality Best Practices. 5) How Do You Measure Data Quality? 6) Data Quality Metrics Examples. 7) Data Quality Control: Use Case. 8) The Consequences Of Bad Data Quality. 9) 3 Sources Of Low-Quality Data. Enters data quality management.

article thumbnail

Take Advantage Of Operational Metrics & KPI Examples – A Comprehensive Guide

datapine

Using data in today’s businesses is crucial to evaluate success and gather insights needed for a sustainable company. By establishing clear operational metrics and evaluate performance, companies have the advantage of using what is crucial to stay competitive in the market, and that’s data.

KPI 269
Insiders

Sign Up for our Newsletter

This site is protected by reCAPTCHA and the Google Privacy Policy and Terms of Service apply.

Trending Sources

article thumbnail

A Beginner’s Guide To Inventory Metrics And Best Practices

datapine

In our cutthroat digital economy, massive amounts of data are gathered, stored, analyzed, and optimized to deliver the best possible experience to customers and partners. At the same time, inventory metrics are needed to help managers and professionals in reaching established goals, optimizing processes, and increasing business value.

Metrics 286
article thumbnail

A Data-Driven Guide To Skyrocket Your Year Over Year Growth

datapine

YoY growth is an effective means of measuring your ongoing progress and making sure your business is moving in the right direction. Here we’re going to look at the concept of YoY and consider how you can use this essential metric to your business-boosting advantage. That’s where year over year (YoY) growth enters the mix.

article thumbnail

Remove Your Rose Tinted Glasses: Data Visualizations Designed to Mislead

datapine

1) Misleading Data Visualization Examples. 2) How to Avoid Misleading Visuals. 3) The Impact Of Bad Data Visualizations. But while that may be the case, people are duped by data visualizations every day. Bad data visualizations come in many forms, with some more obvious than others.

article thumbnail

Two Downs Make Two Ups: The Only Success Metrics That Matter For Your Data & Analytics Team

DataKitchen

How to measure your data analytics team? So it’s Monday, and you lead a data analytics team of perhaps 30 people. And she is numbers driven – great! But wait, she asks you for your team metrics. Like most leaders of data analytic teams, you have been doing very little to quantify your team’s success.

Metrics 130
article thumbnail

How Recruitment Metrics & Dashboards Can Help Improve Hiring New Candidates

datapine

To compete, evolve, and remain relevant, today’s forward-thinking businesses always strive to improve the efficiency of their internal processes while measuring their success – and hiring talent is no exception. That’s where recruitment metrics come in. Exclusive Bonus Content: What are recruiting metrics & dashboards for?

Metrics 210