Remove Download Remove KPI Remove Measurement Remove Visualization
article thumbnail

Build Up Your Performance With KPI Scorecards – Examples & Templates

datapine

In this post, we will explain what is a KPI scorecard, when to use it, what is the difference between scorecard and dashboard, and KPI scorecard examples and templates from business scenarios that can be applied to different departments and organizations or used as a roadmap for online data analysis. What Is A KPI Scorecard?

Scorecard 226
article thumbnail

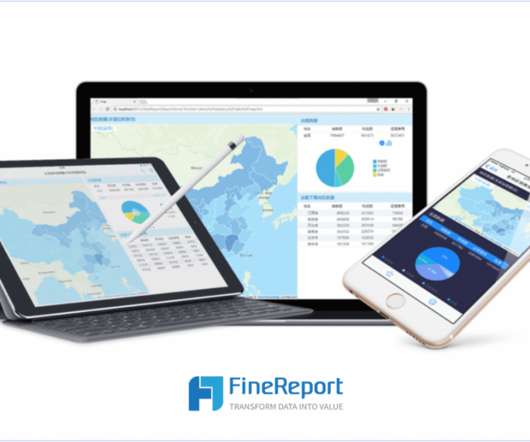
What is a KPI Report? Definition, Examples, and How-tos

FineReport

Key Performance Indicators (KPIs) serve as vital metrics that help measure progress towards business goals. To effectively monitor and analyze these metrics, businesses utilize KPI reports. In this case, a straightforward KPI framework may appear as follows: Objective: Achieve a 20% increase in leads.

KPI 52
Insiders

Sign Up for our Newsletter

This site is protected by reCAPTCHA and the Google Privacy Policy and Terms of Service apply.

Trending Sources

article thumbnail

KPI Dashboard: Keys To Achieve Better Performance

FineReport

KPI dashboard releases you from your worries and troubles. What is a KPI dashboard? Definition of KPI dashboard. KPIs (Key performance indicators) are quantitative indicators used to measure the work performance of staff, being the foundation of an enterprise performance management system.

KPI 52
article thumbnail

Your Definitive Guide To Building Valuable Narratives Through Data Storytelling

datapine

By gaining centralized access to business data and presenting it in a visual way that follows a logical path and provides invaluable insights on a particular area or subject, you stand to set yourself apart from your competitors and become a leader in your field. Download our free executive summary and start creating your stories!

KPI 193
article thumbnail

8 Examples Of Financial Reports You Can Use For Daily, Weekly, And Monthly Reports

datapine

A data-driven finance report is also an effective means of remaining updated with any significant progress or changes in the status of your finances, and help you measure your financial results, cash flow, and financial position. Download our short executive guide to daily, weekly and monthly reports! What Is A Finance Report?

Reporting 251
article thumbnail

Getting Started With Incremental Sales – Best Practices & Examples

datapine

Here we explore the meaning and value of incremental sales in the world of business, as well as the additional KPI examples and metrics you should track to ensure ongoing success. Incremental sales is a KPI used by marketers to assess the financial value of various promotional activities. What Are Incremental Sales?

Sales 176
article thumbnail

Checklist of Data Dashboard for 2021? Definition, Examples & More

FineReport

Similar to the instrument panel equipped in a car, it transforms obscure expertise into plain visualizations which are pleasing to both the eye and mind. A data dashboard is a useful tool that could display and analyze users’ complex data by means of data visualization so that the user gains a deep insight into the value of data.