Remove Experimentation Remove Interactive Remove Metrics Remove Visualization
article thumbnail

eCommerce Brands Use Data Analytics for Conversion Rate Optimization

Smart Data Collective

Understanding E-commerce Conversion Rates There are a number of metrics that data-driven e-commerce companies need to focus on. It is a crucial metric that provides priceless information about your website’s ability to transform visitors into paying customers. Some of the most important is conversion rates.

article thumbnail

Interview with: Sankar Narayanan, Chief Practice Officer at Fractal Analytics

Corinium

It is also important to have a strong test and learn culture to encourage rapid experimentation. Newer methods can work with large amounts of data and are able to unearth latent interactions. One approach is to use NLP techniques to analyze actual call center interactions with customers.

Insurance 250
Insiders

Sign Up for our Newsletter

This site is protected by reCAPTCHA and the Google Privacy Policy and Terms of Service apply.

article thumbnail

Higher-ed CIOs embrace academia’s AI challenges

CIO Business Intelligence

But we also have teams responsible for data analytics, and teams of audio-visual experts to ensure our concert halls and event centers can support a range of activities. We developed a model to predict student outcomes based on metrics from historical evidence,” he says. “We But we wound up with over 100,000 the first summer.

article thumbnail

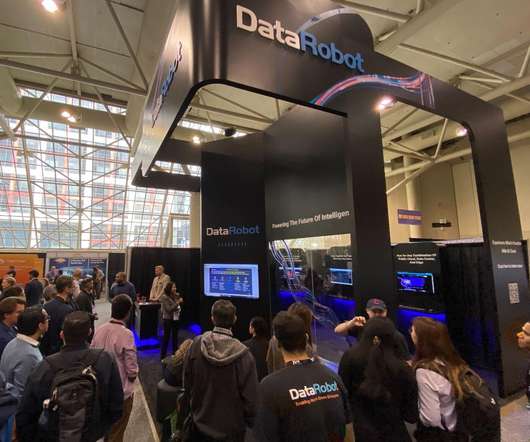
3 AI Trends from the Big Data & AI Toronto Conference

DataRobot Blog

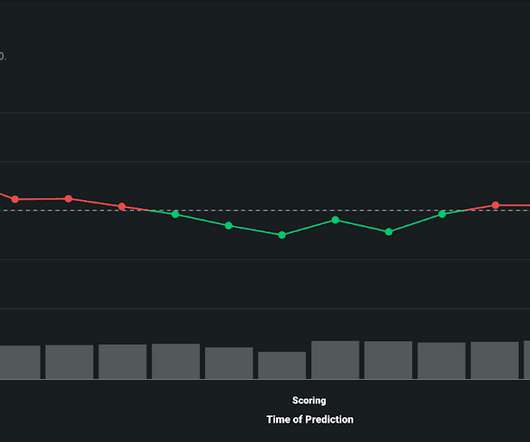
Model Observability – the ability to track key health and service metrics for models in production – remains a top priority for AI-enabled organizations. We dug into interactive visualizations such as the DataRobot drift drill down plot , where users can investigate the exact feature and time period affected by data drift in a model.

article thumbnail

Towards optimal experimentation in online systems

The Unofficial Google Data Science Blog

the weight given to Likes in our video recommendation algorithm) while $Y$ is a vector of outcome measures such as different metrics of user experience (e.g., Experiments, Parameters and Models At Youtube, the relationships between system parameters and metrics often seem simple — straight-line models sometimes fit our data well.

article thumbnail

Building AI with AutoML and Composable ML

DataRobot

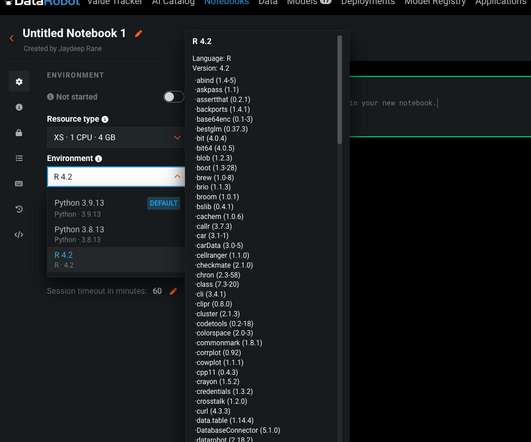
After adding the preferred code, teams can take advantage of the existing DataRobot capabilities, such as metrics, explainability, visualizations, deployment, monitoring, collaboration, and governance. In data science , the best results come through experimentation. So let’s dig in! Run AutoPilot.

article thumbnail

Next Stop – Predicting on Data with Cloudera Machine Learning

Cloudera

The third video in the series highlighted Reporting and Data Visualization. To effectively leverage their predictive capabilities and maximize time-to-value these companies need an ML infrastructure that allows them to quickly move models from data pipelines, to experimentation and into the business. Schedule ML Jobs.