article thumbnail

Document Information Extraction Using Pix2Struct

Analytics Vidhya

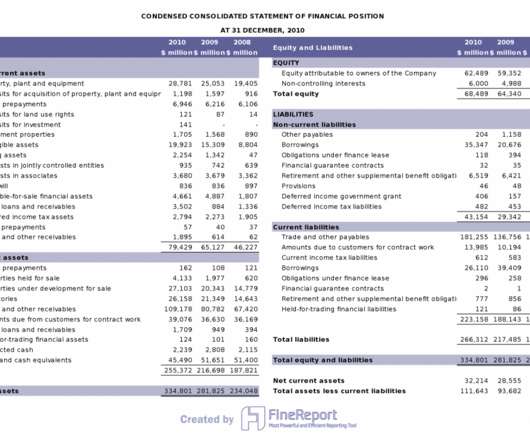
Introduction Document information extraction involves using computer algorithms to extract structured data (like employee name, address, designation, phone number, etc.) from unstructured or semi-structured documents, such as reports, emails, and web pages.

article thumbnail

The Ultimate Guide to Power BI Visualizations

Analytics Vidhya

Introduction Power BI has emerged as a formidable tool within data science, enabling businesses to formulate informed decisions rooted in data-driven insights. Developed by Microsoft, Power BI Visualizations empower users to visually represent their data and disseminate insights seamlessly across organizational echelons.

Insiders

Sign Up for our Newsletter

This site is protected by reCAPTCHA and the Google Privacy Policy and Terms of Service apply.

article thumbnail

Remove Your Rose Tinted Glasses: Data Visualizations Designed to Mislead

datapine

1) Misleading Data Visualization Examples. 2) How to Avoid Misleading Visuals. 3) The Impact Of Bad Data Visualizations. But while that may be the case, people are duped by data visualizations every day. Bad data visualizations come in many forms, with some more obvious than others. Table of Contents.

article thumbnail

Discover The Power Of Modern Performance Reports – See Examples & Best Practices 

datapine

Table of Contents 1) What Is A Performance Report? 2) The Importance of Performance Reports 3) Performance Report Examples 4) Performance Reporting Tips Performance reporting has been a traditional business practice for decades now. At the time, this was not an issue, as the static nature of reporting was the norm.

Reporting 207
article thumbnail

Monetizing Analytics Features: Why Data Visualizations Will Never Be Enough

Think your customers will pay more for data visualizations in your application? But today, dashboards and visualizations have become table stakes. Five years ago they may have. Discover which features will differentiate your application and maximize the ROI of your embedded analytics. Brought to you by Logi Analytics.

article thumbnail

Top 10 Management Reporting Best Practices To Create Effective Reports

datapine

Management reporting is a source of business intelligence that helps business leaders make more accurate, data-driven decisions. But, these reports are only as useful as the work that goes into preparing and presenting them. By the end of this article, making stunning and useful managerial reports will be second nature to you.

Reporting 263
article thumbnail

Your Introduction To CFO Dashboards & Reports In The Digital Age

datapine

Not only are you responsible for the ongoing financial strategy of your organization, but you’re probably expected to provide timely, accurate reports to a variety of stakeholders. CFO reports supercharge your financial initiatives. Benefit from great CFO dashboards & reports! What Is A CFO Report?

article thumbnail

Embedding Operational Reports: Everything Product Managers Should Know

Speaker: Dean Yao, Sr. Director of Product Marketing, Logi Analytics

Operational reports help get information to the people who need it most, in formats they understand, and in a timeframe that matters. Join the webinar to learn how embedding operational reports can give your users a precisely formatted, ready-to-analyze view of their operational activities.