
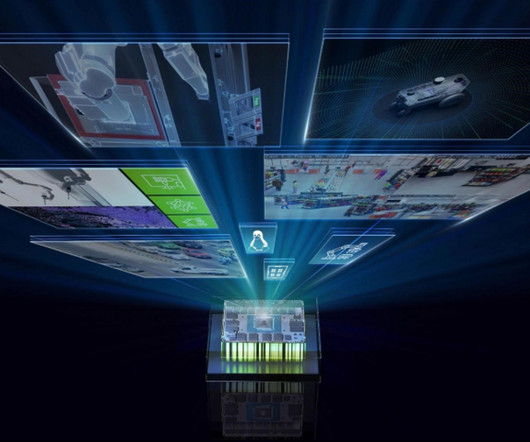
Nvidia Introduces VILA: Visual Language Intelligence and Edge AI 2.0
Analytics Vidhya
MAY 6, 2024
Introduction Visual Language Models (VLMs) are revolutionizing the way machines comprehend and interact with both images and text. Nvidia and MIT have recently launched a VLM named VILA, enhancing the capabilities of […] The post Nvidia Introduces VILA: Visual Language Intelligence and Edge AI 2.0


Let's personalize your content