article thumbnail

Diversity Report Template

Juice Analytics

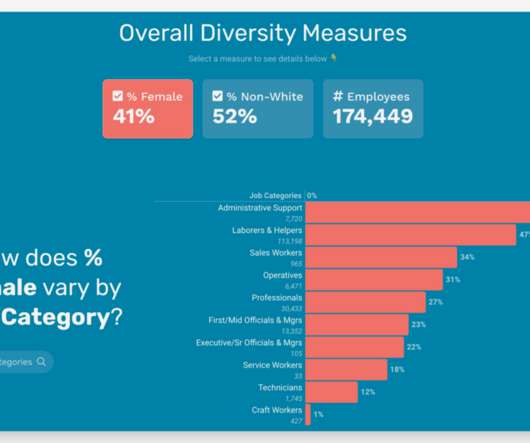
via As You Sow Whether from a consumer, social advocacy, or shareholder pressures, a small set of companies have stepped forward to create ‘Diversity, Inclusion, and Equity Reports’ to publicly share their current status and what they are doing to improve. It is provided in an annual report called the EEO-1. Ready to create your own?

Reporting 135
article thumbnail

Data and Analytics Hype Cycles for 2020 Just Published!

Andrew White

Hype Cycle for Customer Experience Analytics, 2020 Customer experience has been transformed by the explosion of channels and digital interactions, and the volume and connections of diverse data types. Data and analytics leaders should use this report to understand key trends and innovations. appeared first on Andrew White.

Insiders

Sign Up for our Newsletter

This site is protected by reCAPTCHA and the Google Privacy Policy and Terms of Service apply.

article thumbnail

How To Interact With Power BI Data In A PowerPoint Presentation

Smart Data Collective

Microsoft Power BI is a Business Intelligence and Data Visualization tool which assists organizations to analyze data from multiple sources, convert it into an interactive dashboard and share insights. What’s more amazing is that you can publish and share reports with others using this platform.

article thumbnail

Creating an Alternative Law School Rankings Report

Juice Analytics

The The New York Times recently published a story: “Defending Its Rankings, U.S. News Takes Aim at Top Law Schools” ( paywalled ) about how Law Schools are fed up with the US News & World Report rankings, and how the magazine is fighting back. I was particularly struck by this passage: Ms. Check it out ?

article thumbnail

Effective Report Design: a step-by-step guide

FineReport

The design of reports can be considered from two aspects: layout and system. You may have seen many articles emphasize how to improve the layout of the report. Today, let’s learn the report designing from the perspective of the report system. The Basics of Report Designing . The Basics of Report Designing .

article thumbnail

Enterprise Reporting: The 2020’s Comprehensive Guide

FineReport

What Is Enterprise Reporting? Enterprise reporting is a process of extracting, processing, organizing, analyzing, and displaying data in the companies. It uses enterprise reporting tools to organize data into charts, tables, widgets, or other visualizations. And enterprise reporting is a more specific category within BI.

article thumbnail

Report Builder Introduction, Tutorial, and Alternative

FineReport

Report Builder is a report creation tool provided by Microsoft. It supports developing build dashboards and paginated reports based on data from various data sources with less effort. It is suitable for business users who prefer to work in a stand-alone environment instead of using Report Designer in Visual Studio / SSDT.