article thumbnail

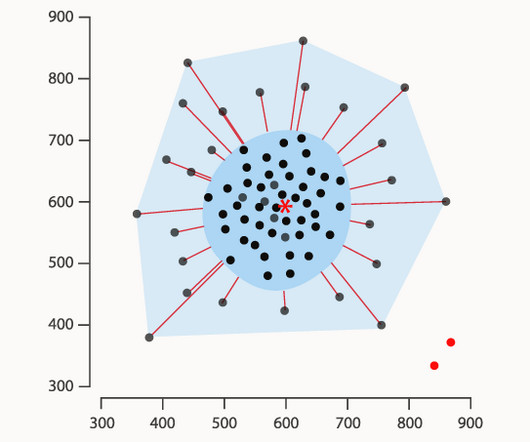
Chart Snapshot: Bagplots

The Data Visualisation Catalogue

It achieves this by presenting the data through three distinct nested polygons: the bag , fence , and loop. COMPUTATION OF ROBUST STATISTICS: DEPTH, MEDIAN, AND RELATED MEASURES Figure 4. In Part (b) Logarithms are taken of Both Variables. The Bagplot: A Bivariate Boxplot Figure 58.1.2, Tukey Bagplot.

article thumbnail

Optimize checkpointing in your Amazon Managed Service for Apache Flink applications with buffer debloating and unaligned checkpoints – Part 2

AWS Big Data

We’ve already discussed how checkpoints, when triggered by the job manager, signal all source operators to snapshot their state, which is then broadcasted as a special record called a checkpoint barrier. When barriers from all upstream partitions have arrived, the sub-task takes a snapshot of its state.

Insiders

Sign Up for our Newsletter

This site is protected by reCAPTCHA and the Google Privacy Policy and Terms of Service apply.

article thumbnail

Your Definitive Guide To KPI Tracking By Utilizing Modern Software & Tools

datapine

By measuring KPIs regularly and automatically, you can increase productivity and decrease costs. . Doing so will not only help you to squeeze additional value from your organizational data, but it will also provide the opportunity to set performance targets and measure incremental success in vital areas of the business.

KPI 195
article thumbnail

Getting Started With Incremental Sales – Best Practices & Examples

datapine

Incremental Sales Calculation As mentioned, incremental sales are used by businesses as a key performance indicator to measure the financial success of their promotional efforts. To ensure you yield the results you desire, first establish your goals, then decide on the metrics that you will need to track to measure your performance.

Sales 176
article thumbnail

What is a KPI Report? Definition, Examples, and How-tos

FineReport

Key Performance Indicators (KPIs) serve as vital metrics that help measure progress towards business goals. A KPI report, also known as KPI reporting, serves as a management tool for measuring, organizing, and analyzing the primary key performance indicators that are vital to a business. Free Download of FineReport 1.

KPI 52
article thumbnail

10 Examples of How Big Data in Logistics Can Transform The Supply Chain

datapine

According to studies, 92% of data leaders say their businesses saw measurable value from their data and analytics investments. The rise of SaaS business intelligence tools is answering that need, providing a dynamic vessel for presenting and interacting with essential insights in a way that is digestible and accessible.

Big Data 275
article thumbnail

Power enterprise-grade Data Vaults with Amazon Redshift – Part 2

AWS Big Data

Although these areas can also be critical areas of consideration for any data warehouse data model, in our experience, these areas present their own flavor and special needs to achieve data vault implementations at scale. There are two possible routes to create materialized views for the presentation data mart layer.