article thumbnail

Automate AWS Clean Rooms querying and dashboard publishing using AWS Step Functions and Amazon QuickSight – Part 2

AWS Big Data

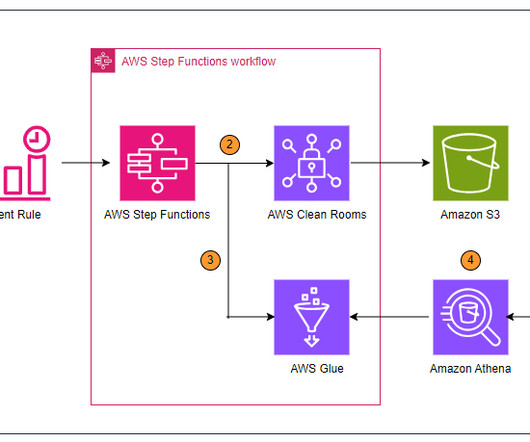
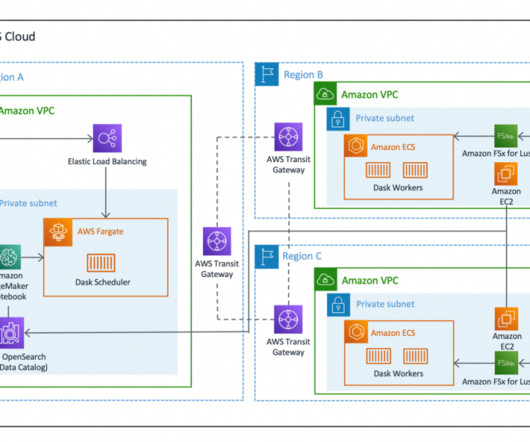
Instead, they rely on up-to-date dashboards that help them visualize data insights to make informed decisions quickly. We automate running queries using Step Functions with Amazon EventBridge schedules, build an AWS Glue Data Catalog on query outputs, and publish dashboards using QuickSight so they automatically refresh with new data.

article thumbnail

Metadata is Like Packaging: Seeing Beyond the Library Card Metaphor

Ontotext

way we package information has a lot to do with metadata. The somewhat conventional metaphor about metadata is the one of the library card. This metaphor has it that books are the data and library cards are the metadata helping us find what we need, want to know more about or even what we don’t know we were looking for.

Metadata 124
Insiders

Sign Up for our Newsletter

This site is protected by reCAPTCHA and the Google Privacy Policy and Terms of Service apply.

Trending Sources

article thumbnail

Enhance monitoring and debugging for AWS Glue jobs using new job observability metrics, Part 3: Visualization and trend analysis using Amazon QuickSight

AWS Big Data

QuickSight makes it straightforward for business users to visualize data in interactive dashboards and reports. An AWS Glue crawler scans data on the S3 bucket and populates table metadata on the AWS Glue Data Catalog. You can deploy the end-to-end solution to visualize and analyze trends of the observability metrics.

Metrics 107
article thumbnail

Ingest, transform, and deliver events published by Amazon Security Lake to Amazon OpenSearch Service

AWS Big Data

OpenSearch Service is a fully managed and scalable log analytics framework that is used by customers to ingest, store, and visualize data. We also walk you through how to use a series of prebuilt visualizations to view events across multiple AWS data sources provided by Security Lake. Choose Import.

article thumbnail

Biggest Trends in Data Visualization Taking Shape in 2022

Smart Data Collective

It can be used for something as visual as reducing traffic jams, to personalizing products and services, to improving the experience in multiplayer video games. We would like to talk about data visualization and its role in the big data movement. Data is useless without the opportunity to visualize what we are looking for.

article thumbnail

How Cargotec uses metadata replication to enable cross-account data sharing

AWS Big Data

This data needs to be ingested into a data lake, transformed, and made available for analytics, machine learning (ML), and visualization. To share the datasets, they needed a way to share access to the data and access to catalog metadata in the form of tables and views. The target accounts read data from the source account S3 buckets.

article thumbnail

GraphDB Empowers Scientific Projects to Fight COVID-19 and Publish Knowledge Graphs

Ontotext

The FHIRCat group at the Mayo Clinic has published the CORD-19-on-FHIR dataset for COVID-19 research. GraphDB’s Visual Graph can be used to explore the data as demonstrated below. Here, GraphDB is used for storing the ontology models, the vocabulary, the content metadata and the graphs from the PICO ontology. The Mayo Clinic.