article thumbnail

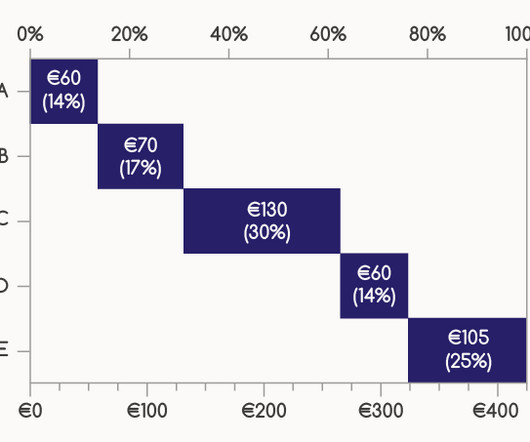
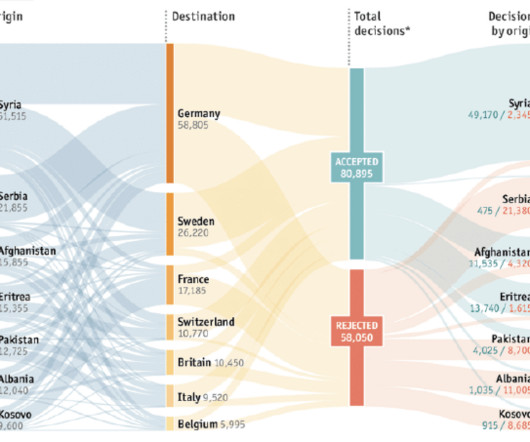
Chart Snapshot: Bagplots

The Data Visualisation Catalogue

It provides a visual delineation of the main body of the data, illustrating its shape and arrangement within the dataset. This depth median signifies the point with the highest Tukey depth, providing a central reference point for the data distribution.

article thumbnail

Chart Snapshot: Progressive Bar Charts

The Data Visualisation Catalogue

Progressive Bar Charts sometimes include an additional bar representing the total of all individual segments, providing viewers with a clear reference point for the overall value.

Insiders

Sign Up for our Newsletter

This site is protected by reCAPTCHA and the Google Privacy Policy and Terms of Service apply.

article thumbnail

Chart Snapshot: Alluvial Diagrams + Examples

The Data Visualisation Catalogue

I want to try out writing a series of post that briefly explore a type of visualisation that’s not in the 60 chart reference pages listed on the main part of the website. I already have a long list of charts I want to research and write about, but at the moment it’s too ambitious to go into the depth I would like to go for all of them.

article thumbnail

Use Apache Iceberg in your data lake with Amazon S3, AWS Glue, and Snowflake

AWS Big Data

AWS Glue is a serverless data integration service that allows you to visually create, run, and monitor extract, transform, and load (ETL) pipelines to load data into your data lakes in Iceberg format. Snowflake integrates with AWS Glue Data Catalog to retrieve the snapshot location.

article thumbnail

Your Introduction To CFO Dashboards & Reports In The Digital Age

datapine

CFO reports provide a mix of visual KPIs geared towards helping financial officers make confident, informed decisions based on a variety of core financial activities. Operating profit margin: Also referred to as earnings before interests and tax, this CFO KPI demonstrates what’s left from the revenue after paying all operational costs.

article thumbnail

Architectural patterns for real-time analytics using Amazon Kinesis Data Streams, part 1

AWS Big Data

Refer to Amazon Kinesis Data Streams integrations for additional details. With Kinesis Data Streams, customers can continuously capture terabytes of time series data from thousands of sources for cleaning, enrichment, storage, analysis, and visualization. The raw data can be streamed to Amazon S3 for archiving.

Analytics 109
article thumbnail

Your Definitive Guide To KPI Tracking By Utilizing Modern Software & Tools

datapine

By selecting the right KPIs for various areas of the business, it’s possible to use them to arrange as well as visualize large datasets. Communication: KPI reports and trackers are visual and interactive, which means that they are incredibly inclusive. To track KPIs is to gain greater business intelligence.

KPI 195