article thumbnail

Why Game Studios Should Exploit Visual Analytics | BizAcuity

BizAcuity

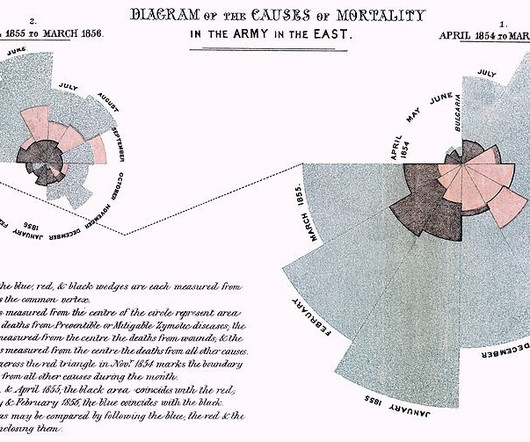
It is evident that the future of igaming (for the Operators as well as the Game Studios) is being shaped by analytics. However, many Game Studios struggle with implementing analytics tools and solutions for their business for two main reasons-. Evolution from MS Excel to Visual Reporting. Modern Visual Analytics Tools.

article thumbnail

Celebrating Women in Data Visualization & Storytelling

Juice Analytics

We wanted to take some time at the end of the month to celebrate female pioneers and influential women in data visualization and storytelling! Florence Nightingale: Florence Nightingale is considered to be one of the first pioneers of data visualization.

Insiders

Sign Up for our Newsletter

This site is protected by reCAPTCHA and the Google Privacy Policy and Terms of Service apply.

Trending Sources

article thumbnail

A Brief History of Data Visualization

Jet Global

Editors note: This blog was originally published in October 2013, and has been completely revamped and updated for accuracy, relevancy, and comprehensiveness in September 2019 Prior to the 17th century, data visualization existed mainly in the realm of maps, displaying land markers, cities, roads, and resources.

article thumbnail

Celebrating Women in Data Visualization

Juice Analytics

March is Women’s History Month and as a company that celebrates women, we wanted to highlight some of the most influential women in the history of data visualization! Florence Nightingale: Florence Nightingale is considered to be one of the first pioneers of data visualization. Hull House Chicago Maps by Florence Kelley go-wage-maps/.

article thumbnail

Monetizing Analytics Features: Why Data Visualizations Will Never Be Enough

Think your customers will pay more for data visualizations in your application? But today, dashboards and visualizations have become table stakes. Discover which features will differentiate your application and maximize the ROI of your embedded analytics. Brought to you by Logi Analytics. Five years ago they may have.

article thumbnail

Data Visualizations in Python and R

Sisense

In Next-Level Moves , we dig into the ways advanced analytics are paving the way for the next wave of innovation. The human brain processes visual data better than any other kind of data, which is good because about 90% of the information our brains process is visual. This where the power of visualizations is apparent.

article thumbnail

From Disparate Data to Visualized Knowledge Part III: The Outsider Perspective

Ontotext

In 2013, actually, with SPARQL 1.1. Visualization tools and data access. Data analytics can be a bit elitist. This is why, when we move towards the business side, often some kind of visualization is required. GraphDB is not primarily a data visualization tool. That does not mean that it cannot visualize data.