article thumbnail

Remove Your Rose Tinted Glasses: Data Visualizations Designed to Mislead

datapine

1) Misleading Data Visualization Examples. 2) How to Avoid Misleading Visuals. 3) The Impact Of Bad Data Visualizations. But while that may be the case, people are duped by data visualizations every day. Bad data visualizations come in many forms, with some more obvious than others. Table of Contents.

article thumbnail

Closing Data's Last-Mile Gap: Visualizing For Impact!

Occam's Razor

Experiment with visualization options, even in Excel! The bar chart is a sub-optimal way to let the audience see this. Consider experimenting with different visuals in Excel ( or D3js ). Consider experimenting with different visuals in Excel ( or D3js ). Why have two fat bars? The money needs to go to you!).

Insiders

Sign Up for our Newsletter

This site is protected by reCAPTCHA and the Google Privacy Policy and Terms of Service apply.

article thumbnail

12 most popular AI use cases in the enterprise today

CIO Business Intelligence

Organizations all around the globe are implementing AI in a variety of ways to streamline processes, optimize costs, prevent human error, assist customers, manage IT systems, and alleviate repetitive tasks, among other uses. And with the rise of generative AI, artificial intelligence use cases in the enterprise will only expand.

article thumbnail

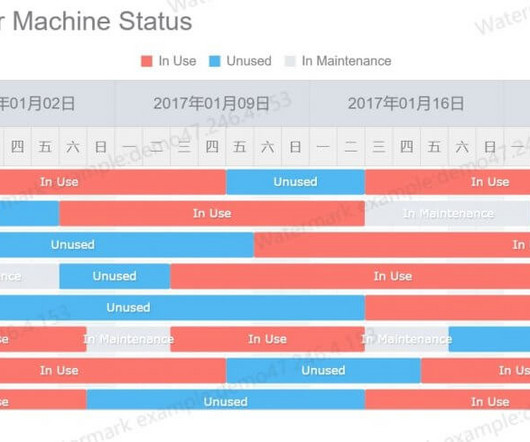
Gantt Chart: Examples, Tools, and Templates

FineReport

Gantt charts are instrumental in optimizing long-term plans by breaking down mid-to-long-term goals into more manageable short-term plans. Therefore, I will also introduce how to use the professional business intelligence software FineReport as a Gantt chart generator, quickly producing professional and visually appealing Gantt charts.

article thumbnail

NHL turns to venue metrics data to drive sustainability

CIO Business Intelligence

It followed that in 2014 with the first sustainability report issued by a North American professional sports league and, in 2015, a commitment to counterbalance the league’s entire carbon footprint for three consecutive seasons. Sustainability is all about innovation and business optimization.

Metrics 144
article thumbnail

Take Your SQL Skills To The Next Level With These Popular SQL Books

datapine

We have already given you our top data visualization books , top business intelligence books , and best data analytics books. Its visually rich format is designed for the way your brain works, not in a text-heavy approach that puts you to sleep. 17) “SQL Database Programming” (2015 Edition) By Chris Fehily.

article thumbnail

Upcoming Power BI Workshop in Huntington Beach, CA – Apr 10, 2015

Ms SQL Girl

Actionable Visualization In Power BI. Apr 10, 2015 7:45 AM – 5:15 PM. Early bird (until Apr 1, 2015) $99.00. The first step before creating data visualization using Power View and Pivot Tables/Charts in Excel, we need to acquire the data from various data sources. I look forward to seeing you there!