article thumbnail

New Thinking, Old Thinking and a Fairytale

Peter James Thomas

Of course it can be argued that you can use statistics (and Google Trends in particular) to prove anything [1] , but I found the above figures striking. © Scott Adams (2017) – dilbert.com. In 2017, a survey estimated that 68 percent of American offices had low or no separation between workers. Source: Google Trends.

article thumbnail

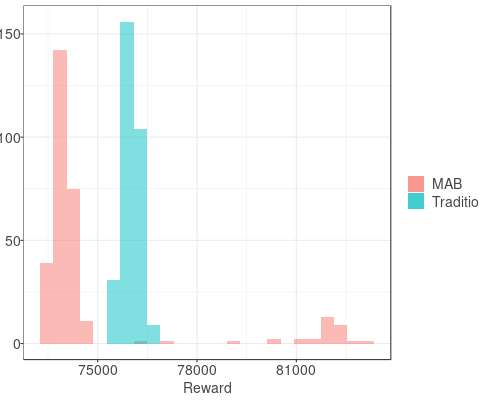
Towards optimal experimentation in online systems

The Unofficial Google Data Science Blog

If $Y$ at that point is (statistically and practically) significantly better than our current operating point, and that point is deemed acceptable, we update the system parameters to this better value. Crucially, it takes into account the uncertainty inherent in our experiments.

Insiders

Sign Up for our Newsletter

This site is protected by reCAPTCHA and the Google Privacy Policy and Terms of Service apply.

article thumbnail

Our quest for robust time series forecasting at scale

The Unofficial Google Data Science Blog

Quantification of forecast uncertainty via simulation-based prediction intervals. Prediction Intervals A statistical forecasting system should not lack uncertainty quantification. Accessed on 20 March 2017. Journal of Official Statistics 6.1 Forecasting: principles and practice. OTexts, 2014. Specifically, see "1.4

article thumbnail

Changing assignment weights with time-based confounders

The Unofficial Google Data Science Blog

For example, imagine a fantasy football site is considering displaying advanced player statistics. A ramp-up strategy may mitigate the risk of upsetting the site’s loyal users who perhaps have strong preferences for the current statistics that are shown. One reason to do ramp-up is to mitigate the risk of never before seen arms.

article thumbnail

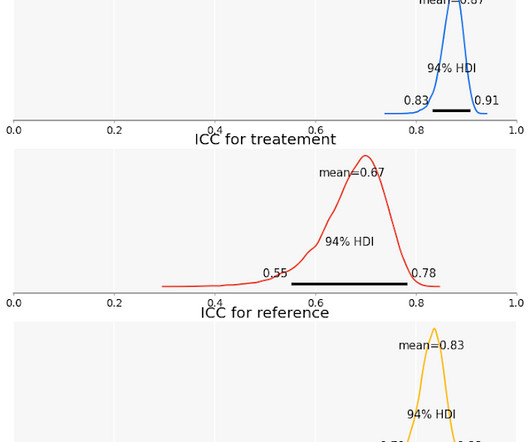
Measuring Validity and Reliability of Human Ratings

The Unofficial Google Data Science Blog

Editor's note : The relationship between reliability and validity are somewhat analogous to that between the notions of statistical uncertainty and representational uncertainty introduced in an earlier post. But for more complicated metrics like xRR, our preference is to bootstrap when measuring uncertainty.

article thumbnail

Fitting Bayesian structural time series with the bsts R package

The Unofficial Google Data Science Blog

SCOTT Time series data are everywhere, but time series modeling is a fairly specialized area within statistics and data science. They may contain parameters in the statistical sense, but often they simply contain strategically placed 0's and 1's indicating which bits of $alpha_t$ are relevant for a particular computation. by STEVEN L.

article thumbnail

Fact-based Decision-making

Peter James Thomas

Integrity of statistical estimates based on Data. Having spent 18 years working in various parts of the Insurance industry, statistical estimates being part of the standard set of metrics is pretty familiar to me [7]. The thing with statistical estimates is that they are never a single figure but a range. million ± £0.5

Metrics 49