article thumbnail

2018 Call for Code Winner Project OWL advances its natural disaster communication network

IBM Big Data Hub

Formed in 2018 to compete in the inaugural Call for Code Global Challenge — which it won — Project OWL is a global team of entrepreneurs focused on creating radically cost-effective and easy to use aerospace technologies. This is where Project OWL comes into play: developing new technologies to help address these challenges.

IT 72
article thumbnail

The Importance Of Financial Reporting And Analysis: Your Essential Guide

datapine

Financial analysis and reporting are one of the bedrocks of modern business. While you may already know that financial reporting is important (mainly because it’s a legal requirement in most countries), you may not understand its untapped power and potential. Exclusive Bonus Content: Your cheat sheet on reporting in finance!

Reporting 248
Insiders

Sign Up for our Newsletter

This site is protected by reCAPTCHA and the Google Privacy Policy and Terms of Service apply.

article thumbnail

Chart Snapshot: Area Bands

The Data Visualisation Catalogue

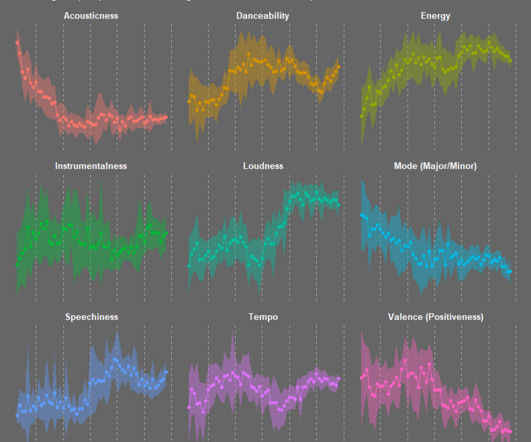
Area Bands enhance standard Line Graphs by filling the space between upper and lower value lines with a shaded area, providing a visual representation of the range boundaries. Essentially, this is a visual enhancement to a graph, which offers more detail and context to data changing over time.
article thumbnail

Visual Business Intelligence Workshop in the United States

Perceptual Edge

For the first time since I retired from teaching data visualization workshops in 2018, Nick Desbarats of Practical Reporting Inc. will be teaching my courses publicly in the United States.

article thumbnail

Microsoft Data Analyst Associate certification guide

CIO Business Intelligence

Earlier this year, Microsoft announced it would retire 15 certifications and 44 exams, including MCSA: BI Reporting, which validated data analysts' expertise using Power BI and Excel to visualize data via dashboards and reports.

article thumbnail

Closing Data's Last-Mile Gap: Visualizing For Impact!

Occam's Razor

I see reports, dashboards, presentations with wide gaps. It is not important where this 2018 analysis came from. If you pause and consider how this data is collected, via a small triple digit sample self-reported survey results, you’ll quickly realize that the error range in this data is likely a few points.

article thumbnail

A history of tech adaptation for today’s changing business needs

CIO Business Intelligence

Following this, in 2002, it began delivering its knowledge to customers in online format, using dashboards and interactive reports that provided easier and faster access to data and analysis. Additionally, it continuously explores reams of data and modern tools to improve its capabilities and adapt to the changing data landscape.