Remove 2019 Remove Blog Remove Statistics Remove Visualization
article thumbnail

Misleading Statistics Examples – Discover The Potential For Misuse of Statistics & Data In The Digital Age

datapine

1) What Is A Misleading Statistic? 2) Are Statistics Reliable? 3) Misleading Statistics Examples In Real Life. 4) How Can Statistics Be Misleading. 5) How To Avoid & Identify The Misuse Of Statistics? If all this is true, what is the problem with statistics? What Is A Misleading Statistic?

article thumbnail

The Top 20 Data Visualization Books That Should Be On Your Bookshelf

datapine

But often that’s how we present statistics: we just show the notes, we don’t play the music.” – Hans Rosling, Swedish statistician. Data visualization, or ‘data viz’ as it’s commonly known, is the graphic presentation of data. That’s a colossal number of books on visualization. Data visualization: What You Need To Know.

Insiders

Sign Up for our Newsletter

This site is protected by reCAPTCHA and the Google Privacy Policy and Terms of Service apply.

Trending Sources

article thumbnail

A Brief History of Data Visualization

Jet Global

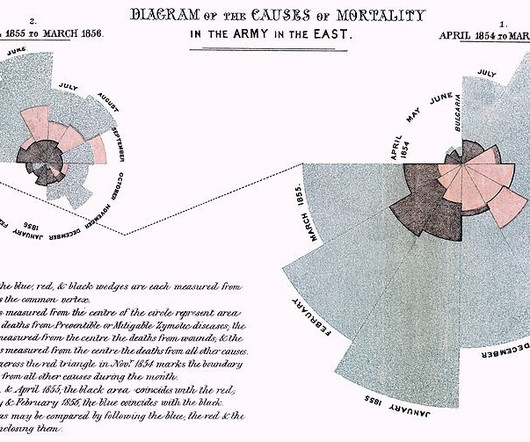
Editors note: This blog was originally published in October 2013, and has been completely revamped and updated for accuracy, relevancy, and comprehensiveness in September 2019 Prior to the 17th century, data visualization existed mainly in the realm of maps, displaying land markers, cities, roads, and resources.

article thumbnail

How to Visualize Confidence Intervals in Presentation Slides

Depict Data Studio

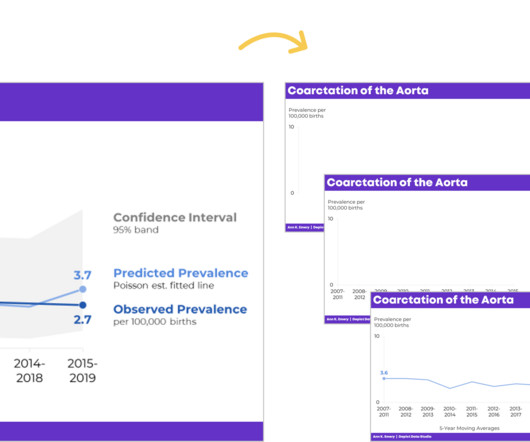
Do you need to share statistics in presentations? In this blog post, you’ll learn how to explain dense graphs one slide at a time, which makes it easier for our audience to follow along. If you work in public health, then you know that the tiny text and statistical terminology is pretty common in scientific graphs.

article thumbnail

Data Visualization and Visual Analytics: Seeing the World of Data

Sisense

In a world increasingly dominated by data, users of all kinds are gathering, managing, visualizing, and analyzing data in a wide variety of ways. Data visualization and visual analytics are two terms that come up a lot when new and experienced analytics users alike delve into the world of data in their quest to make smarter decisions.

article thumbnail

10 Year Anniversary & Top 10 Charts in 2023

The Data Visualisation Catalogue

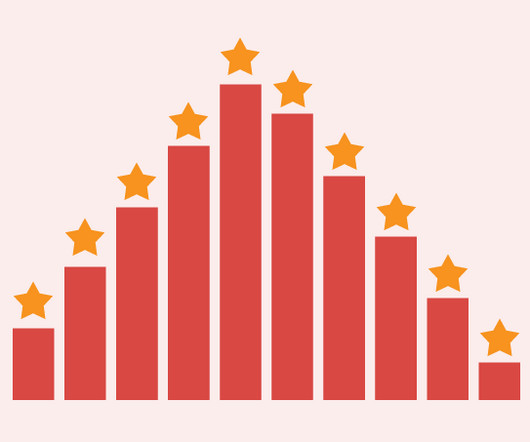
Subsequently, a shop was introduced, and later, this blog was added to provide additional content and learning. Yet, although I struggle to produce enough content for this blog, I am committed to making new posts when possible. I hope that The Data Visualization Catalogue will persist in fulfilling this role in the years ahead.

article thumbnail

Unleash the Power of Advanced Analytics with the Sisense Q4 2019 Release

Sisense

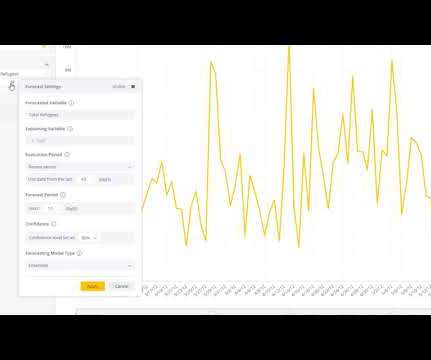
The merger of Periscope Data in May 2019 brings robust functionality for cloud data experts to work with their data as needed while supporting a wide breadth of users and use cases. We’ll share further advancements in our AI strategy and progress on our merger with Periscope Data during the next quarterly product blog release.