article thumbnail

The Top 20 Data Visualization Books That Should Be On Your Bookshelf

datapine

Now that you’re sold on the power of data analytics in addition to data-driven BI, it’s time to take your journey a step further by exploring how to effectively communicate vital metrics and insights in a concise, inspiring, and accessible format through the power of visualization. They can be fun and interactive, too.

article thumbnail

Data Visualization and Visual Analytics: Seeing the World of Data

Sisense

In a world increasingly dominated by data, users of all kinds are gathering, managing, visualizing, and analyzing data in a wide variety of ways. Data visualization and visual analytics are two terms that come up a lot when new and experienced analytics users alike delve into the world of data in their quest to make smarter decisions.

Insiders

Sign Up for our Newsletter

This site is protected by reCAPTCHA and the Google Privacy Policy and Terms of Service apply.

Trending Sources

article thumbnail

Data Visualization: “Master of None” in Data Analysis

FineReport

Why We Need Data Visualization?. If you want to be a data analyst , mastering data visualization skills is essential, cause in most cases, the boss cares more about the results presented. What are the Views of Data Visualization? So, which view you want to use depends on what purpose you want the data to visualize.

article thumbnail

New Online Data Summit Coming Fall 2019

Data Science 101

It is not just a conference or webinar, it will be an interactive online platform. Some of the topics from the summit include: Data Science IoT Streaming Data AI Data Visualization. What: Cloud Data Summit Where: Online (a new conference platform) When: October 16-17, 2019 How to pre-register: Register Online.

IoT 95
article thumbnail

Embedding Operational Reports: Everything Product Managers Should Know

Speaker: Dean Yao, Sr. Director of Product Marketing, Logi Analytics

World-class software teams are embedding operational reports to empower end users with interactive data visualizations, detailed information, and highly precise formats that can be shared via email, PDF, print, or online. April 25, 2019 11:00 AM PDT, 2:00 PM EDT, 7:00 PM BST

article thumbnail

Top 10 Power BI Blogs of 2019

Jet Global

Its data visualizations provide easily digestible insights into your business via robust, interactive dashboards. We are proud to announce our first list of Top 10 PBI Blogs for 2019 to help you harness the raw power of Power BI as well as your other BI needs. List last updated on March 5, 2019. Excelerator BI.

article thumbnail

5 key areas for tech leaders to watch in 2020

O'Reilly on Data

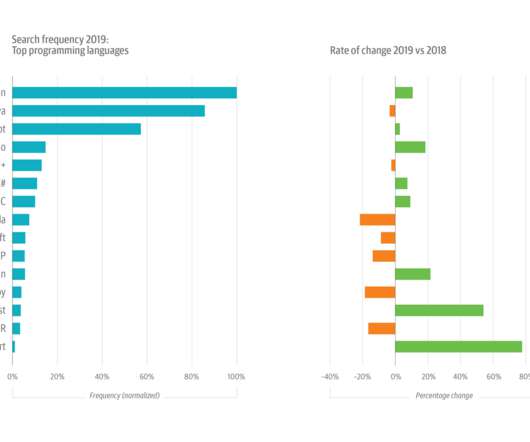
Growth is still strong for such a large topic, but usage slowed in 2018 (+13%) and cooled significantly in 2019, growing by just 7%. But sustained interest in cloud migrations—usage was up almost 10% in 2019, on top of 30% in 2018—gets at another important emerging trend. Still cloud-y, but with a possibility of migration.