Remove Analytics Remove Article Remove KPI Remove Visualization
article thumbnail

Take Advantage Of Operational Metrics & KPI Examples – A Comprehensive Guide

datapine

We have written about management reporting methods that can be utilized in the modern practice of creating powerful analysis, bringing complex data into simple visuals, and employ them to make actionable decisions. Your Chance: Want to visualize & track operational metrics with ease? What Is An Operational KPI?

KPI 269
article thumbnail

Your Definitive Guide To KPI Tracking By Utilizing Modern Software & Tools

datapine

While there are numerous KPI examples you can choose from, you should pick only the most important ones and focus on the right ones for your business. That said, using the right KPIs is essential to both your immediate and long-term business activities. But first, let’s ask ourselves the question, ‘ What is KPI tracking?’.

KPI 195
Insiders

Sign Up for our Newsletter

This site is protected by reCAPTCHA and the Google Privacy Policy and Terms of Service apply.

Trending Sources

article thumbnail

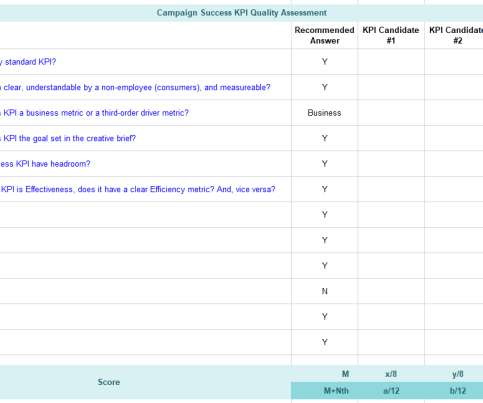
Transform Data's Impact: Pick The Right Success KPI!

Occam's Razor

The KPI you chose for your brand campaign was Trust, it had a pre-set target of +5. AKA: You picked the wrong KPI for the campaign. Note 1: I’m going to use the phrase Success KPI a lot. You can measure seven additional metrics – say for diagnostic purposes -, but there has to be just one Success KPI. Bad Success KPI.

KPI 105
article thumbnail

Remove Your Rose Tinted Glasses: Data Visualizations Designed to Mislead

datapine

1) Misleading Data Visualization Examples. 2) How to Avoid Misleading Visuals. 3) The Impact Of Bad Data Visualizations. But while that may be the case, people are duped by data visualizations every day. Bad data visualizations come in many forms, with some more obvious than others. Table of Contents.

article thumbnail

13 Essential Data Visualization Techniques, Concepts & Methods To Improve Your Business – Fast

datapine

“By visualizing information, we turn it into a landscape that you can explore with your eyes. 90% of the information transmitted to the brain is visual. Data visualization methods refer to the creation of graphical representations of information. That’s where data visualization comes in. A sort of information map.

article thumbnail

Your Guide To Modern Agency Analytics, Dashboards & Reporting Techniques

datapine

The answer is modern agency analytics reports and interactive dashboards. In this article, we will cover every fundamental aspect to take advantage of agency analytics. Let’s dig in with the definition of agency analytics. Your Chance: Want to test a powerful agency analytics software? What Are Agency Analytics?

article thumbnail

AI In Analytics: Today and Tomorrow!

Smarten

In this article, we will discuss the current state of AI in analytics, as well as the future of this burgeoning industry and how it can be applied to analytics to simplify and clarify results and to make analytics easier for businesses and business users to leverage.