Remove Analytics Remove Demo Remove Metrics Remove Reporting
article thumbnail

Enhance monitoring and debugging for AWS Glue jobs using new job observability metrics, Part 3: Visualization and trend analysis using Amazon QuickSight

AWS Big Data

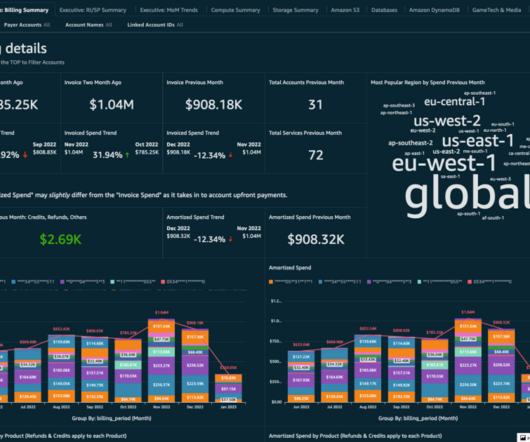
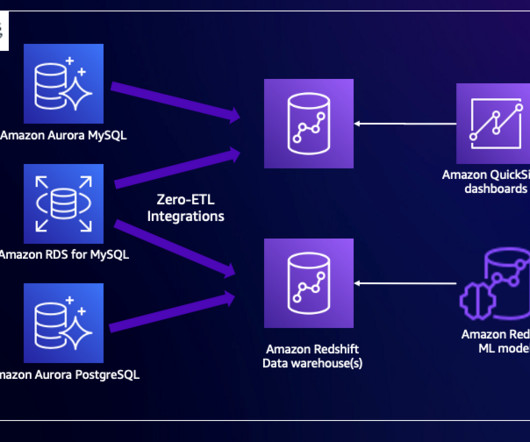
In Part 2 of this series, we discussed how to enable AWS Glue job observability metrics and integrate them with Grafana for real-time monitoring. QuickSight makes it straightforward for business users to visualize data in interactive dashboards and reports. Grafana provides powerful customizable dashboards to view pipeline health.

Metrics 104
article thumbnail

Top 22 Real Estate KPIs and Metrics for 2021 Reporting

Jet Global

A real estate Key Performance Indicator (KPI) or metric is a quantifiable measure used to assess the performance of a business in the real estate industry. These performance metrics can be used to analyze several different business segments from individual realtor performance to investment property potential. Is it worth your time?

Metrics 98
Insiders

Sign Up for our Newsletter

This site is protected by reCAPTCHA and the Google Privacy Policy and Terms of Service apply.

article thumbnail

Top 25+ Retail KPIs and Metrics for 2020 Reporting

Jet Global

A retail Key Performance Indicator (KPI) or metric is a clearly defined and quantifiable measure that can be used to assess the performance of a retail business. These performance metrics can be used in a variety of ways. To help business owners with their analytics, we recommend the use of a retail KPI dashboard.

Metrics 64
article thumbnail

DataKitchen Resource Guide To Data Journeys & Data Observability & DataOps

DataKitchen

DataKitchen Resource Guide To Data Journeys & Data Observability & DataOps Data (and Analytic) Observability & Data Journey – Ideas and Background Data Journey Manifesto and Why the Data Journey Manifesto? Five Pillars of Data Journeys Data Journey First DataOps “You Complete Me,” said Data Lineage to Data Journeys.

Testing 117
article thumbnail

What Is An Operational Report? A Complete Guide

FineReport

Operational reports have the potential to greatly enhance business performance through the utilization of data-driven insights. These reports offer a structured and comprehensible representation of data, enabling a clearer understanding of complex issues that might otherwise remain elusive. What Is An Operational Report?

article thumbnail

Three Emerging Analytics Products Derived from Value-driven Data Innovation and Insights Discovery in the Enterprise

Rocket-Powered Data Science

I recently saw an informal online survey that asked users which types of data (tabular, text, images, or “other”) are being used in their organization’s analytics applications. The results showed that (among those surveyed) approximately 90% of enterprise analytics applications are being built on tabular data.

article thumbnail

Dashboard Metrics: Your KPI Guidelines and Practices

FineReport

Metrics dashboards enable you and your team to track the effectiveness of various tactics, campaigns, and processes. These KPI metrics are critical data to analyze and evaluate a company’s sales, human resources, and marketing, and operational activities. Dashboard metrics from FineReport. What is dashboard metrics.

KPI 52