article thumbnail

Master Data Visualization Techniques: A Comprehensive Guide

FineReport

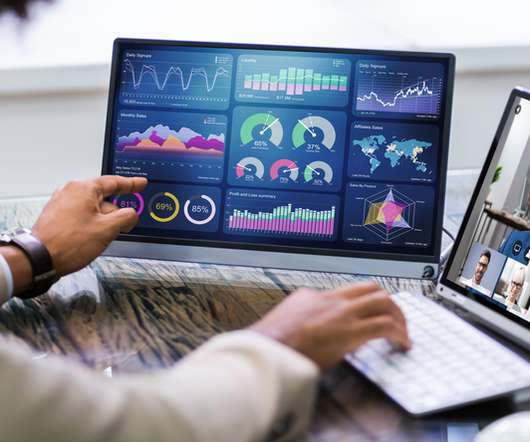
Data visualization techniques are paramount in today’s data-driven world. Mastering data visualization techniques is not just a skill but a necessity for professionals across various industries. It plays a crucial role in simplifying complex datasets into easily understandable visuals.

article thumbnail

What is IoT Dashboard?

FineReport

An IoT dashboard serves as a data visualization instrument that restructures and presents a set of data obtained and transmitted by network-connected devices. Its main objective is to furnish easily understandable information, enabling the remote monitoring of historical and real-time IoT data in a concise manner.

IoT 52
Insiders

Sign Up for our Newsletter

This site is protected by reCAPTCHA and the Google Privacy Policy and Terms of Service apply.

Trending Sources

article thumbnail

The Data Fluency Framework

Juice Analytics

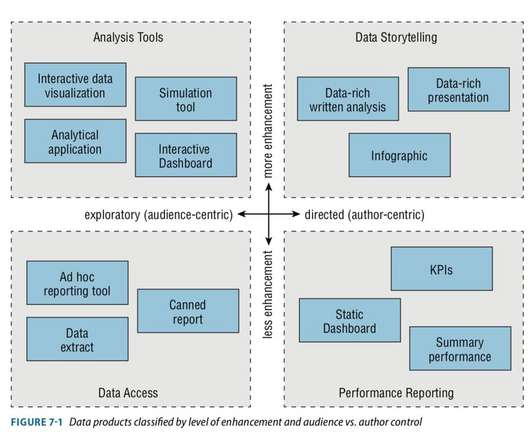
The answer is not simply a better dashboard or more carefully designed data visualizations. The foundation of getting value from data depends on creating a data fluent culture in your organization. There are many benefits of having a data fluent culture , but what does it take to get there?

article thumbnail

Everything You Need to Know About Project Management Dashboard

FineReport

Moreover, the implementation of an effective Project Management Dashboard facilitates data-driven decision-making and sustainable business success. Project management dashboards serve as dynamic visual aids, empowering project managers to effectively track project progress, identify risks, and allocate tasks to team members efficiently.

article thumbnail

Three Ways Intentional Data Viz Has Elevated My Work

Depict Data Studio

She has long been passionate about creating data visualizations that are easy to understand, tell a story, and help stakeholders make informed decisions. I want my clients to take away key points from the qualitative data I collect and report. What My Qualitative Data Visualization Used to Look Like.

article thumbnail

QlikView vs Qlik Sense vs FineReport, who is better BI tool in 2023?

FineReport

Users can create visual reports according to their own wishes and achieve self-service analysis. Users can create visualized reports according to their own preferences and achieve self-service analysis. Data Visualization When it comes to data visualization, Qlik Sense and FineReport each have their own strengths.

article thumbnail

R vs Python: What’s the Best Language for Natural Language Processing?

Sisense

NLP can be used on written text or speech data. For our example, we will use written text for our comparison of R vs Python for data science. We are surrounded by written text every day: emails, SMS messages, webpages, books, and much more. R vs Python for data science: Digging into the differences.