Remove Dashboards Remove Data Collection Remove Data-driven Remove Metrics
article thumbnail

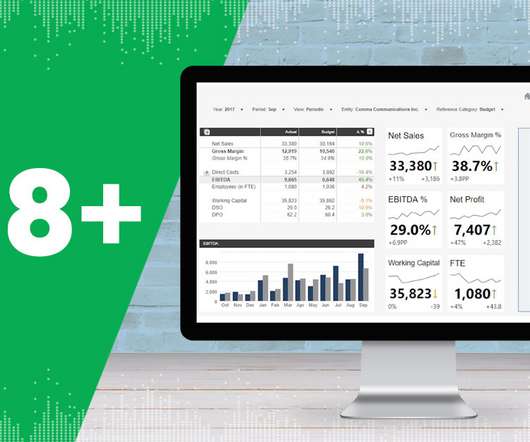
Utilize The Undeniable Power Of Professional COO Dashboards & Reports

datapine

We won’t delve into details about the career prospects of this C-level position but we will present COO dashboards and reports that are critical for helping chief operating officers across the world to effectively manage their time, company, operational processes, and results. How to create a COO dashboard? What is a COO report?

article thumbnail

NHL turns to venue metrics data to drive sustainability

CIO Business Intelligence

To reduce its carbon footprint and mitigate climate change, the National Hockey League (NHL) has turned to data and analytics to gauge the sustainability performance of the arenas where its teams play. The only way for you to speak in the language of business is to have the data that help you derive those insights.”

Metrics 144
Insiders

Sign Up for our Newsletter

This site is protected by reCAPTCHA and the Google Privacy Policy and Terms of Service apply.

article thumbnail

Two Downs Make Two Ups: The Only Success Metrics That Matter For Your Data & Analytics Team

DataKitchen

How to measure your data analytics team? So it’s Monday, and you lead a data analytics team of perhaps 30 people. And she is numbers driven – great! But wait, she asks you for your team metrics. Like most leaders of data analytic teams, you have been doing very little to quantify your team’s success.

Metrics 130
article thumbnail

Everything You Need to Know About Project Management Dashboard

FineReport

Thus, one tool that has gained significant popularity in recent years is the Project Management Dashboard. Moreover, the implementation of an effective Project Management Dashboard facilitates data-driven decision-making and sustainable business success. What Is A Project Management Dashboard?

article thumbnail

Digital Dashboard: Make You Prosper In Digital Era

FineReport

Are you still using the traditional cumbersome and redundant data collection methods? Have you ever neglected key indicators because of irrelevant data in your decision-making? No need to be worried anymore, all these management problems could be settled with digital dashboard. Digital dashboard software.

article thumbnail

28 Best Insurance KPIs and Metrics Examples for 2020 Reporting

Jet Global

An insurance Key Performance Indicator (KPI) or metric is a measure that an insurance company uses to monitor its performance and efficiency. Insurance metrics can help a company identify areas of operational success, and areas that require more attention to make them successful. How to Build Useful KPI Dashboards.

article thumbnail

A Guide To The Methods, Benefits & Problems of The Interpretation of Data

datapine

1) What Is Data Interpretation? 2) How To Interpret Data? 3) Why Data Interpretation Is Important? 4) Data Analysis & Interpretation Problems. 5) Data Interpretation Techniques & Methods. 6) The Use of Dashboards For Data Interpretation. What Is Data Interpretation? Table of Contents.