Remove Dashboards Remove KPI Remove Marketing Remove Risk
article thumbnail

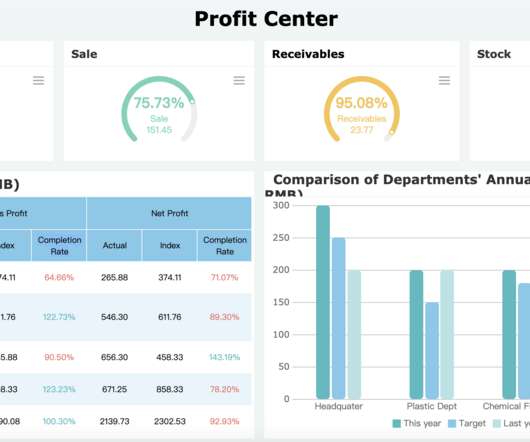
Take Advantage Of Operational Metrics & KPI Examples – A Comprehensive Guide

datapine

By establishing clear operational metrics and evaluate performance, companies have the advantage of using what is crucial to stay competitive in the market, and that’s data. In other words, by analyzing KPI examples for a specific industry or function, a business can reduce the amount of time needed to evaluate the overall performance.

KPI 269
article thumbnail

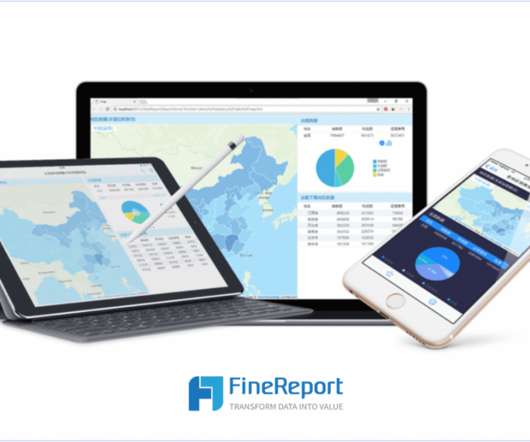
Dashboard Metrics: Your KPI Guidelines and Practices

FineReport

As technology advances, the use of data-driven dashboards is becoming increasingly important. Metrics dashboards enable you and your team to track the effectiveness of various tactics, campaigns, and processes. Dashboard metrics from FineReport. What is dashboard metrics. It uses a performance metrics dashboard.

KPI 52
Insiders

Sign Up for our Newsletter

This site is protected by reCAPTCHA and the Google Privacy Policy and Terms of Service apply.

Trending Sources

article thumbnail

Move Beyond Excel, PowerPoint And Static Business Reporting with Powerful Interactive Dashboards

datapine

Soon businesses of all sizes will have so much amount of information that dashboard software will be the most invaluable resource a company can have. That’s why we welcome you to the world of interactive dashboards. Your Chance: Want to test interactive dashboard software for free? What Is An Interactive Dashboard?

article thumbnail

Make Sure You Know The Difference Between Strategic, Analytical, Operational And Tactical Dashboards

datapine

This is where the power of business dashboards comes into play. Dashboards often are the best way to gain insight into an organization and its various departments, operations and performance. Well-built, focused dashboards easily serve up summaries and reports of the BI that’s most critical to the organization.

article thumbnail

Get Started With Business Performance Dashboards – Examples & Templates

datapine

Studies suggest that businesses that adopt a data-driven marketing strategy are likely to gain an edge over the competition and in turn, increase profitability. In fact, according to eMarketer, 40% of executives surveyed in a study focused on data-driven marketing, expect to “significantly increase” revenue. Still unsure?

article thumbnail

Insurance Dashboard Design: KPIs, Analytics & Examples

FineReport

Insurance companies provide risk management in the form of insurance contracts. The insurance dashboard is one of the most commonly used data display methods. Insurance Dashboard (by FineReport). What are Insurance Dashboards? What are Insurance Dashboards? Types of Insurance Dashboards.

article thumbnail

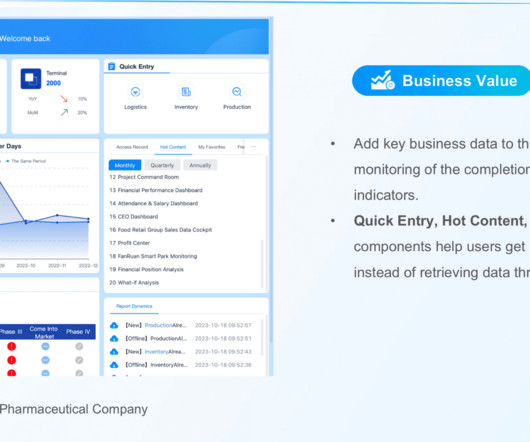
3 Types and 5 Management Dashboard Examples Sorted by Departments

FineReport

Why We Need a Management Dashboard? Therefore, in-flight, trust our dashboard.” The management dashboard is a “one-step” decision support management information center system for executives. In layman’s terms, executives can instantly see all the important data needed to make decisions from a dashboard.