Remove Data Collection Remove Definition Remove Interactive Remove Metrics
article thumbnail

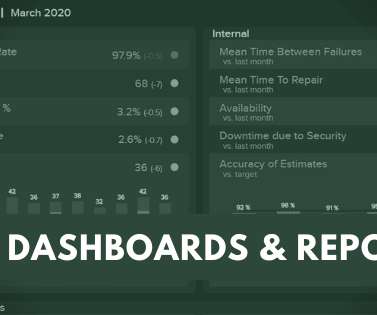
Utilize The Undeniable Power Of Professional COO Dashboards & Reports

datapine

Moreover, companies are becoming more data-driven, complex, and require stable performance in order to succeed in our cutthroat digital age. But let’s start from the beginning and explain basic definitions. That said, in essence, we will discuss: What is a COO dashboard? What is a COO report? How to create a COO dashboard?

article thumbnail

The Lean Analytics Cycle: Metrics > Hypothesis > Experiment > Act

Occam's Razor

To win in business you need to follow this process: Metrics > Hypothesis > Experiment > Act. We are far too enamored with data collection and reporting the standard metrics we love because others love them because someone else said they were nice so many years ago. That metric is tied to a KPI.

Metrics 156
Insiders

Sign Up for our Newsletter

This site is protected by reCAPTCHA and the Google Privacy Policy and Terms of Service apply.

Trending Sources

article thumbnail

My top learning moments at Splunk.conf23

Rocket-Powered Data Science

Here are four specific metrics from the report, highlighting the potentially huge enterprise system benefits coming from implementing Splunk’s observability and monitoring products and services: Four times as many leaders who implement observability strategies resolve unplanned downtime in just minutes, not hours or days.

article thumbnail

What Is Rum data and why does it matter?

IBM Big Data Hub

Contrary to what you might think, RUM data isn’t a performance indicator for Captain Morgan, Cuban tourism or a Disney film franchise. Real User Monitoring (RUM) data is information about how people interact with online applications and services. Are there alternatives to RUM data? Why “real”?

IT 71
article thumbnail

Unlocking Growth Potential: A Guide to Effective KPI Tracking

FineReport

In this article, we will explore the concept of KPI tracking, its definition, its importance for businesses, and how to perform KPI tracking. Monitoring key performance indicators (KPIs) using modern KPI software is a definitive method to monitor your most relevant KPIs and achieve increased success. What Is KPI Tracking?

KPI 52
article thumbnail

A Guide To The Methods, Benefits & Problems of The Interpretation of Data

datapine

Through the art of streamlined visual communication, data dashboards permit businesses to engage in real-time and informed decision-making and are key instruments in data interpretation. First of all, let’s find a definition to understand what lies behind data interpretation meaning. What is the keyword? Dependable.

article thumbnail

Mastering Data Analysis Report and Dashboard

FineReport

As we explore examples of data analysis reports and interactive report data analysis dashboards, we embark on a journey to unravel the nuanced art of transforming raw data into meaningful narratives that empower decision-makers. Try FineReport Now 1.1 Without effective ad campaigns, customer acquisition is hindered.