article thumbnail

What Is Ad Hoc Reporting? Your Guide To Definition, Meaning, Examples & Benefits

datapine

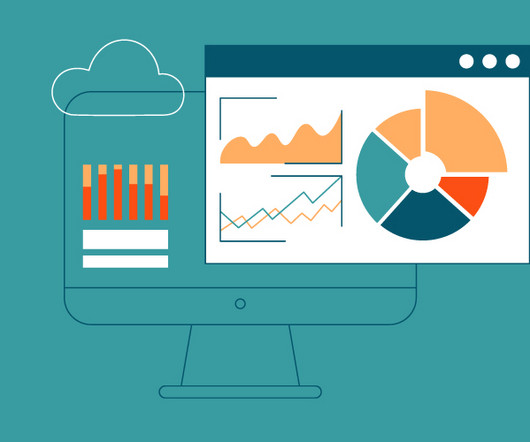
“The goal is to turn data into information, and information into insight.” – Carly Fiorina, former executive, president, HP. Digital data is all around us. quintillion bytes of data every single day, with 90% of the world’s digital insights generated in the last two years alone, according to Forbes. click to enlarge**.

Reporting 260
article thumbnail

An Introduction To Data Dashboards: Meaning, Definition & Industry Examples

datapine

“It is a capital mistake to theorize before one has data.”– Data is all around us. Data has changed our lives in many ways, helping to improve the processes, initiatives, and innovations of organizations across sectors through the power of insight. Let’s kick things off by asking the question: what is a data dashboard?

Insiders

Sign Up for our Newsletter

This site is protected by reCAPTCHA and the Google Privacy Policy and Terms of Service apply.

Trending Sources

article thumbnail

Get Started With Interactive Weekly Reports For Performance Tracking

datapine

Businesses have been analyzing their performance for decades through traditional written reports, but with the amount of data being produced every day, the need for more frequent reporting is growing. This is where interactive weekly reports come into the picture. Let’s kick it off with the definition.

article thumbnail

Your Definitive Guide To Building Valuable Narratives Through Data Storytelling

datapine

By gaining centralized access to business data and presenting it in a visual way that follows a logical path and provides invaluable insights on a particular area or subject, you stand to set yourself apart from your competitors and become a leader in your field. Exclusive Bonus Content: Your definitive guide to data storytelling!

KPI 193
article thumbnail

Move Beyond Excel, PowerPoint And Static Business Reporting with Powerful Interactive Dashboards

datapine

Visualizing the data and interacting on a single screen is no longer a luxury but a business necessity. That’s why we welcome you to the world of interactive dashboards. But before we delve into the bits and pieces of our topic, let’s answer the basic questions: What is an interactive dashboard, and why you need one?

article thumbnail

The Ultimate Guide to Modern Data Quality Management (DQM) For An Effective Data Quality Control Driven by The Right Metrics

datapine

1) What Is Data Quality Management? 4) Data Quality Best Practices. 5) How Do You Measure Data Quality? 6) Data Quality Metrics Examples. 7) Data Quality Control: Use Case. 8) The Consequences Of Bad Data Quality. 9) 3 Sources Of Low-Quality Data. 10) Data Quality Solutions: Key Attributes.

article thumbnail

Business Intelligence and Analytics: Definitive Guide

FineReport

As companies striving to embrace digital transformation and become data-driven, business intelligence and analytics skills and experience are essential to building a data-savvy team. And do you know what the key to unlocking value from data is? Definition. BI Dashboard (by FineReport). Business Analytics.