Remove Data-driven Remove Interactive Remove Measurement Remove Visualization
article thumbnail

Master Data Visualization Techniques: A Comprehensive Guide

FineReport

Data visualization techniques are paramount in today’s data-driven world. Mastering data visualization techniques is not just a skill but a necessity for professionals across various industries. It plays a crucial role in simplifying complex datasets into easily understandable visuals.

article thumbnail

The Ultimate Guide to Modern Data Quality Management (DQM) For An Effective Data Quality Control Driven by The Right Metrics

datapine

1) What Is Data Quality Management? 4) Data Quality Best Practices. 5) How Do You Measure Data Quality? 6) Data Quality Metrics Examples. 7) Data Quality Control: Use Case. 8) The Consequences Of Bad Data Quality. 9) 3 Sources Of Low-Quality Data. 10) Data Quality Solutions: Key Attributes.

Insiders

Sign Up for our Newsletter

This site is protected by reCAPTCHA and the Google Privacy Policy and Terms of Service apply.

article thumbnail

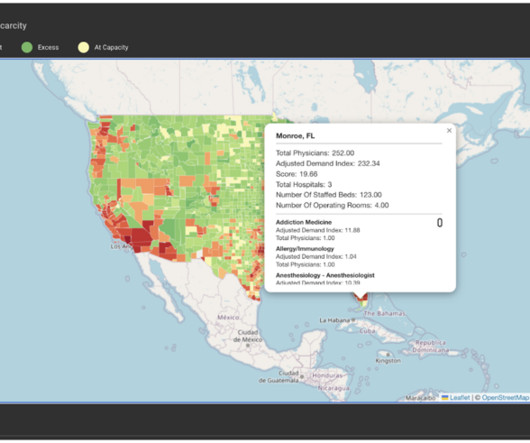
Elevating Healthcare Staffing: From Spreadsheet Chaos to Data-Driven Decisions  

InsightOut

Challenging the Status Quo with Data Insights Historically, Caliber, like many organizations, relied heavily on Microsoft Excel for data management and analysis. Key Outcomes and Benefits National and Granular Insights: The map provides a clear visual representation of physician demand across the U.S.,

article thumbnail

How To Interact With Power BI Data In A PowerPoint Presentation

Smart Data Collective

As a venture grows, it becomes tedious to keep track of the analytical data of the enterprise which, in turn, forms a road-block to decision making. Employing an analytical system in a data-driven business can help it to discover useful trends, information, conclusions and elevated decision making.

article thumbnail

An Introduction To Data Dashboards: Meaning, Definition & Industry Examples

datapine

“It is a capital mistake to theorize before one has data.”– Data is all around us. Data has changed our lives in many ways, helping to improve the processes, initiatives, and innovations of organizations across sectors through the power of insight. Let’s kick things off by asking the question: what is a data dashboard?

article thumbnail

Take Advantage Of Operational Metrics & KPI Examples – A Comprehensive Guide

datapine

Using data in today’s businesses is crucial to evaluate success and gather insights needed for a sustainable company. By establishing clear operational metrics and evaluate performance, companies have the advantage of using what is crucial to stay competitive in the market, and that’s data. What Are Metrics And Why Are They Important?

KPI 269
article thumbnail

4 Data-Driven Approaches To Bolster Email Deliverability

Smart Data Collective

The concept of email marketing predates the big data phenomenon by at least 20 years. However, data-driven insights have clearly played a profound role in the future of email marketing. Companies need to find new ways to use big data to embrace new email strategies. The Evolution of Email in the Age of Big Data.