Remove Experimentation Remove Interactive Remove Metrics Remove Presentation
article thumbnail

Bringing an AI Product to Market

O'Reilly on Data

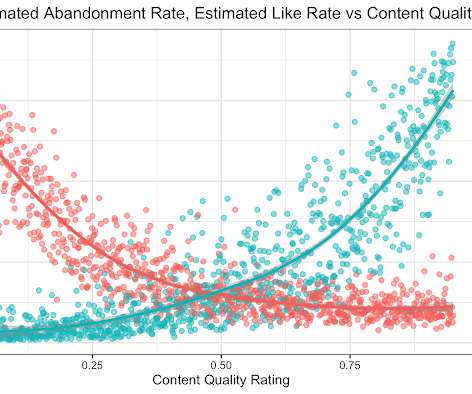
The first step in building an AI solution is identifying the problem you want to solve, which includes defining the metrics that will demonstrate whether you’ve succeeded. It sounds simplistic to state that AI product managers should develop and ship products that improve metrics the business cares about. Agreeing on metrics.

Marketing 362
article thumbnail

Apply Modern CRM Dashboards & Reports Into Your Business – Examples & Templates

datapine

A CRM dashboard is a centralized hub of information that presents customer relationship management data in a way that is dynamic, interactive, and offers access to a wealth of insights that can improve your consumer-facing strategies and communications. Try our professional dashboard software for 14 days, completely free!

Insiders

Sign Up for our Newsletter

This site is protected by reCAPTCHA and the Google Privacy Policy and Terms of Service apply.

Trending Sources

article thumbnail

Learn Data Visualization Techniques for Impactful Visual Representations

FineReport

It involves representing data and information visually, making it easier for individuals to comprehend, analyze, and make decisions based on the presented data. This skill is especially valuable in today’s data-driven world, where the ability to interpret and present data compellingly is highly sought after.

article thumbnail

12 Marketing Reports Examples You Can Use For Annual, Monthly, Weekly And Daily Reporting Practice

datapine

That’s why we will present annual, monthly, weekly, daily and digital marketing reports that you can use for your own promotional activities and upscale your marketing efforts. Structure your metrics. That way you can choose the best possible metrics for your case. Regularly monitor your data. 1) Marketing CMO report.

Reporting 280
article thumbnail

Magnificent Mobile Website And App Analytics: Reports, Metrics, How-to!

Occam's Razor

They will need two different implementations, it is quite likely that you will end up with two sets of metrics (more people focused for mobile apps, more visit focused for sites). Media-Mix Modeling/Experimentation. Mobile content consumption, behavior along key metrics (time, bounces etc.) Implement Cross-Device Tracking.

Metrics 141
article thumbnail

3 AI Trends from the Big Data & AI Toronto Conference

DataRobot Blog

Model Observability – the ability to track key health and service metrics for models in production – remains a top priority for AI-enabled organizations. We dug into interactive visualizations such as the DataRobot drift drill down plot , where users can investigate the exact feature and time period affected by data drift in a model.

article thumbnail

Digital listening reveals 3 leading innovation drivers

CIO Business Intelligence

It surpasses blockchain and metaverse projects, which are viewed as experimental or in the pilot stage, especially by established enterprises. Big Data collection at scale is increasing across industries, presenting opportunities for companies to develop AI models and leverage insights from that data.