Remove Interactive Remove Measurement Remove Optimization Remove Visualization
article thumbnail

Top 15 Warehouse KPIs & Metrics For Efficient Management 

datapine

A Warehouse KPI is a measurement that helps warehousing managers to track the performance of their inventory management, order fulfillment, picking and packing, transportation, and overall operations. These powerful measurements will allow you to track all activities in real-time to ensure everything runs smoothly and safely.

Metrics 217
article thumbnail

10 Examples of How Big Data in Logistics Can Transform The Supply Chain

datapine

You can use big data analytics in logistics, for instance, to optimize routing, improve factory processes, and create razor-sharp efficiency across the entire supply chain. According to studies, 92% of data leaders say their businesses saw measurable value from their data and analytics investments.

Big Data 275
Insiders

Sign Up for our Newsletter

This site is protected by reCAPTCHA and the Google Privacy Policy and Terms of Service apply.

article thumbnail

Take Advantage Of Operational Metrics & KPI Examples – A Comprehensive Guide

datapine

We have written about management reporting methods that can be utilized in the modern practice of creating powerful analysis, bringing complex data into simple visuals, and employ them to make actionable decisions. Your Chance: Want to visualize & track operational metrics with ease? What gets measured gets done.” – Peter Drucker.

KPI 269
article thumbnail

eCommerce Brands Use Data Analytics for Conversion Rate Optimization

Smart Data Collective

One benefit is that they can help with conversion rate optimization. Collecting Relevant Data for Conversion Rate Optimization Here is some vital data that e-commerce businesses need to collect to improve their conversion rates. Heatmaps are powerful visual tools help show where website visitors pay the most attention.

article thumbnail

Utilize The Undeniable Power Of Professional COO Dashboards & Reports

datapine

That’s why using a modern dashboard tool is vital for monitoring and analyzing multiple touchpoints and presenting data in real-time, visually, and with strong interactivity levels so any operational activity can’t be left unnoticed. That said, in essence, we will discuss: What is a COO dashboard? What is a COO report?

article thumbnail

An Introduction To Data Dashboards: Meaning, Definition & Industry Examples

datapine

Data dashboards provide a centralized, interactive means of monitoring, measuring, analyzing, and extracting a wealth of business insights from relevant datasets in several key areas while displaying aggregated information in a way that is both intuitive and visual. What Is A Data Dashboard? click to enlarge**.

article thumbnail

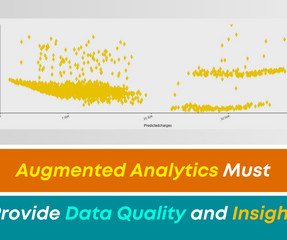
Augmented Analytics Must Provide Data Quality and Insight!

Smarten

What you need are apps and solutions that allow you to ask easy questions in your own words and receive guidance and recommendations on how to best visualize and present your data and what techniques to use to gain the most insight. These measures empower them with a deeper understanding of their data like never before.