article thumbnail

Introducing The Five Pillars Of Data Journeys

DataKitchen

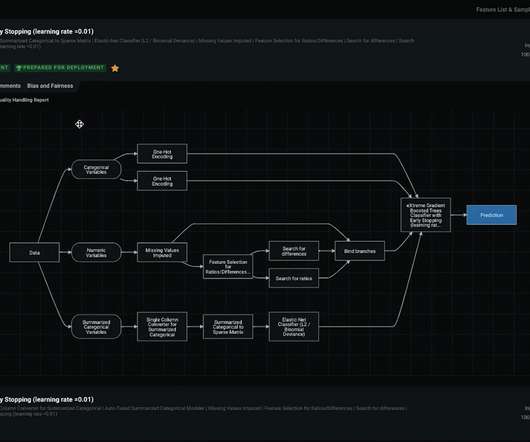
It involves tracking key metrics such as system health indicators, performance measures, and error rates and closely scrutinizing system logs to identify anomalies or errors. The above image shows an example custom ‘data in use’ test of a predictive model and API. Donkey: Oh, they have layers.

Testing 130
article thumbnail

What is business analytics? Using data to improve business outcomes

CIO Business Intelligence

Research firm Gartner defines business analytics as “solutions used to build analysis models and simulations to create scenarios, understand realities, and predict future states.”. Business analytics also involves data mining, statistical analysis, predictive modeling, and the like, but is focused on driving better business decisions.

Insiders

Sign Up for our Newsletter

This site is protected by reCAPTCHA and the Google Privacy Policy and Terms of Service apply.

article thumbnail

Are You Harnessing the Power of SaaS BI Tools for Dynamic Data Access?

FineReport

Additionally, there is a growing demand for advanced analytics and data visualization tools to make data-driven decisions. Key Features of SaaS BI Tools When it comes to SaaS BI tools , one of the key features that sets them apart is their ability to provide real-time data access and visualization.

article thumbnail

Best BI Tools Examples for 2024: Business Intelligence Software

FineReport

From advanced analytics to predictive modeling, the evolving landscape of business intelligence is revolutionizing how data is processed and leveraged for actionable insights. In addition to these advancements, another prominent trend in data analysis is the growing impact of data visualization.

article thumbnail

Smarten Announces SnapShot Anomaly Monitoring Alerts: Powerful Tools for Business Users!

Smarten

Smarten CEO, Kartik Patel says, ‘Smarten SnapShot supports the evolving role of Citizen Data Scientists with interactive tools that allow a business user to gather information, establish metrics and key performance indicators.’

article thumbnail

Data Storytelling: What's Easy and What's Hard

Juice Analytics

Gathering a collection of visualizations and calling it a data story is easy (and inaccurate). Making it meaningful is so much harder. Making data-driven narrative that influences people.hard. Schedule a demo.

article thumbnail

Data science vs data analytics: Unpacking the differences

IBM Big Data Hub

Overview: Data science vs data analytics Think of data science as the overarching umbrella that covers a wide range of tasks performed to find patterns in large datasets, structure data for use, train machine learning models and develop artificial intelligence (AI) applications.