


Enhance monitoring and debugging for AWS Glue jobs using new job observability metrics, Part 3: Visualization and trend analysis using Amazon QuickSight
AWS Big Data
MARCH 29, 2024
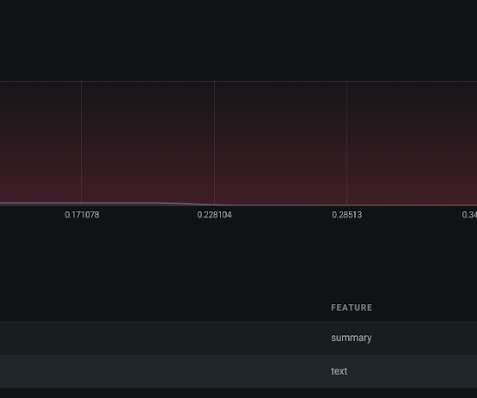
With this integration, you can use line charts, bar charts, and other graph types to uncover daily, weekly, and monthly patterns. The skewness metrics of the job multistage-demo showed 9.53, which is significantly higher than others. For now, let’s filter with the job name multistage-demo. Let’s drill down into details.


Let's personalize your content