
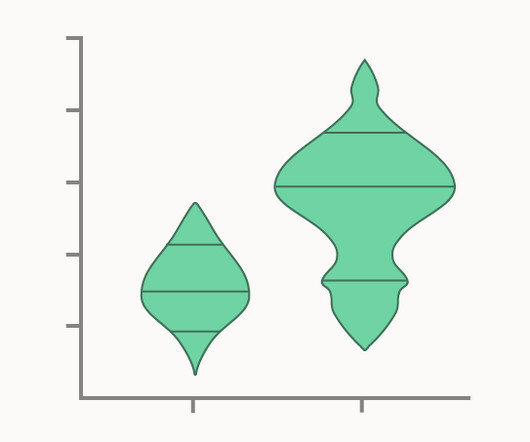
Chart Snapshot: Box-Percentile Plots
The Data Visualisation Catalogue
MAY 6, 2024
i17 Box-percentile plots of height-for-age (HAZ) by country; 2009-10. Examples Figure 6: Box-percentile plots for tree invasions at six different sites in the Madison Valley of Montana. The Box-Percentile Plot, Warren W. Esty and Jeffrey D. Banfield, DOI: 10.18637/jss.v008.i17


Let's personalize your content