article thumbnail

Create Modern SQL Dashboards With Professional Tools & Software

datapine

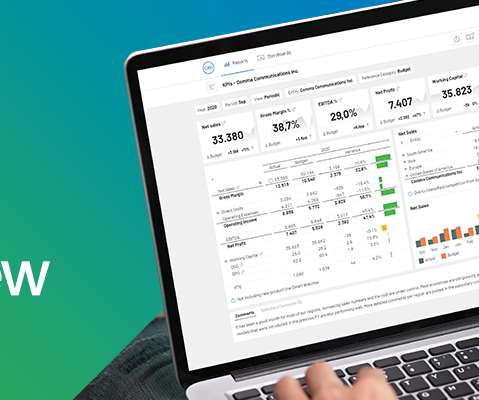
In some cases, you will need a coding solution where you can build your own queries, but in others, you will also look for a visual representation of your realational data. The good news is that you can utilize both with the help of a modern and professional SQL dashboard. What Is A SQL Dashboard? We offer a 14-day free trial.

article thumbnail

2018 Call for Code Winner Project OWL advances its natural disaster communication network

IBM Big Data Hub

Formed in 2018 to compete in the inaugural Call for Code Global Challenge — which it won — Project OWL is a global team of entrepreneurs focused on creating radically cost-effective and easy to use aerospace technologies. This is where Project OWL comes into play: developing new technologies to help address these challenges.

IT 72
Insiders

Sign Up for our Newsletter

This site is protected by reCAPTCHA and the Google Privacy Policy and Terms of Service apply.

article thumbnail

A Complete Guide To Bar Charts With Examples, Benefits, And Different Types 

datapine

2) Pros & Cons Of Bar Charts 3) When To Use A Bar Graph 4) Types Of Bar Charts 5) Bar Graphs & Charts Best Practices 6) Bar Chart Examples In today’s fast-paced analytical landscape, data visualization has become one of the most powerful tools organizations can benefit from to be successful with their analytical efforts.

article thumbnail

Level up your React app with Amazon QuickSight: How to embed your dashboard for anonymous access

AWS Big Data

Using embedded analytics from Amazon QuickSight can simplify the process of equipping your application with functional visualizations without any complex development. There are multiple ways to embed QuickSight dashboards into application. To enable them to consume data, the dashboard needs to be accessible for anonymous users.

article thumbnail

Salesforce extends Flow automations across Mulesoft, Slack and Tableau

CIO Business Intelligence

Now, since acquiring the integration specialist Mulesoft, chat application Slack and the data visualization tool Tableau , the company is extending Flow to work across all of these applications. This is automation on one unified CRM platform. Flow in Slack. Flow Actions for Tableau.

article thumbnail

Build Up Your Performance With KPI Scorecards – Examples & Templates

datapine

In this post, we will explain what is a KPI scorecard, when to use it, what is the difference between scorecard and dashboard, and KPI scorecard examples and templates from business scenarios that can be applied to different departments and organizations or used as a roadmap for online data analysis. Let’s take a look at that in more detail.

Scorecard 226
article thumbnail

Microsoft Data Analyst Associate certification guide

CIO Business Intelligence

Earlier this year, Microsoft announced it would retire 15 certifications and 44 exams, including MCSA: BI Reporting, which validated data analysts' expertise using Power BI and Excel to visualize data via dashboards and reports. To read this article in full, please click here