Remove 2021 Remove Interactive Remove Reporting Remove Visualization
article thumbnail

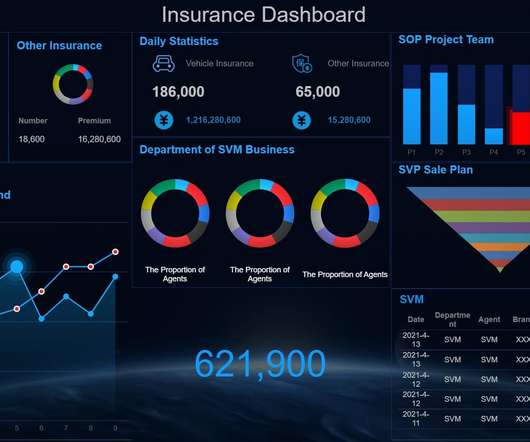
BI Visualization Tools: Top 5 Picks 2021

FineReport

Nowadays, almost all businesses from all works believe in the potential of excellent BI tools to create stunning visualizations and effectively convey business information. There are many BI tools on the market that have potentially efficient visualization capabilities for customers to use. What are BI Visualization Tools?

article thumbnail

Top 5 Report Maker Software & Reporting Software

FineReport

How to Make Reports Outstanding? In the era of data driving the decision, the importance of reporting and analytics is increasingly recognized by organizations. Two things can help you be a great report maker. The first is clear design thinking, and the second is efficient report writing software. Report Maker Tool List.

Insiders

Sign Up for our Newsletter

This site is protected by reCAPTCHA and the Google Privacy Policy and Terms of Service apply.

Trending Sources

article thumbnail

11 Best Data Storytelling Courses 2021

Juice Analytics

If you are looking for a packaged course that will teach you about data visualization, narrative, and engaging your audience, we’ve tracked down some of the best options. By the end of the course, learners will have the skills needed to produce impactful data visualizations layered with compelling narratives. Cost: Starts at $99.

article thumbnail

Four popular Java Dashboards for 2021 ——Examples

FineReport

Featuring ‘expertise, simplicity, flexibility’, FineReport can create the simplest report and large screen, with users commanding the skill of SQL. After the sorting of data and the individual design of visual presentation, large screen visualization for enterprises can be achieved in Java framework. Java Dashboard ?From

article thumbnail

BRIDGEi2i Newsletter: January 2021 Recap

bridgei2i

As we step into 2021 with hope and renewed strength, it’s time to Reimagine your Business…with AI! Download Report. We took an interactive perspective on tracking the aftermath of COVID-19 in different scenarios; through data visualization. Wishing you all a great 2021! Newsletter Q3 2020. Happy New Year!

article thumbnail

4 Data-Driven Ways to Improve Employee Engagement

datapine

Furthermore, 53% of HR professionals report that good onboarding boosts employee engagement rates. According to a 2020 employee engagement report : 93% of highly engaged employees feel like they receive adequate feedback for their performance as opposed to 41% of disengaged employees. Highly engaged employees are 2.3x

article thumbnail

A Guide To Starting A Career In Business Intelligence & The BI Skills You Need

datapine

billion by the end of 2021. For example, if you enjoy computer science, programming, and data but are too extroverted to program all day long, you could work in a more human-oriented area of intelligence for business, perhaps involving more face-to-face interactions than most programmers would encounter on the job.