Remove Data Processing Remove Interactive Remove Optimization Remove Visualization
article thumbnail

Enhance monitoring and debugging for AWS Glue jobs using new job observability metrics, Part 3: Visualization and trend analysis using Amazon QuickSight

AWS Big Data

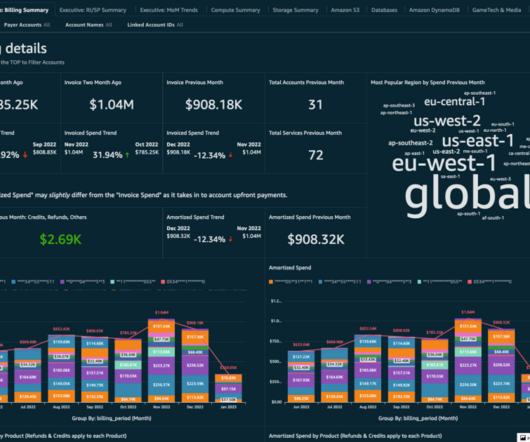
QuickSight makes it straightforward for business users to visualize data in interactive dashboards and reports. Analyzing historical patterns allows you to optimize performance, identify issues proactively, and improve planning. You can deploy the end-to-end solution to visualize and analyze trends of the observability metrics.

Metrics 101
article thumbnail

10 Examples of How Big Data in Logistics Can Transform The Supply Chain

datapine

You can use big data analytics in logistics, for instance, to optimize routing, improve factory processes, and create razor-sharp efficiency across the entire supply chain. Using the right dashboard and data visualizations, it’s possible to hone in on any trends or patterns that uncover inefficiencies within your processes.

Big Data 275
Insiders

Sign Up for our Newsletter

This site is protected by reCAPTCHA and the Google Privacy Policy and Terms of Service apply.

article thumbnail

Your Introduction To CFO Dashboards & Reports In The Digital Age

datapine

Serving as a central, interactive hub for a host of essential fiscal information, CFO dashboards host dynamic financial KPIs and intuitive analytical tools, as well as consolidate data in a way that is digestible and improves the decision-making process. Your Chance: Want to build your own CFO dashboard completely free?

article thumbnail

An Introduction To Data Dashboards: Meaning, Definition & Industry Examples

datapine

Data dashboards provide a centralized, interactive means of monitoring, measuring, analyzing, and extracting a wealth of business insights from relevant datasets in several key areas while displaying aggregated information in a way that is both intuitive and visual. Lack of different data visualization types. click to enlarge**.

article thumbnail

Enable cost-efficient operational analytics with Amazon OpenSearch Ingestion

AWS Big Data

The raw data stored in Amazon S3 can be inexpensively retained for an extended period of time using tiered storage and queried using the Athena query engine, and also visualized using Amazon QuickSight or other data visualization services. Set up the VPC flow logs to publish logs to an S3 bucket in text format.

Analytics 117
article thumbnail

Take Advantage Of Mobile Dashboards – Examples & Selected Designs

datapine

Mobile technology has changed the way we interact with the world around us, and when it comes to analyzing valuable business insights, mobile dashboards offer the freedom and flexibility to turn stats into success while you’re on the go. Why Are Mobile Dashboards Important?

article thumbnail

5 ways IT pros can accelerate webpages in a day at no cost

CIO Business Intelligence

Over the years, hundreds of techniques have been introduced to optimize website speed. Optimize images for the target device Edgio <img src=”…” loading=”lazy” height=”Apx” width=”Bpx” /> Image optimization is the most overlooked technique due to concerns over image quality – especially when converting to formats like WebP.

IT 98