Remove Interactive Remove Measurement Remove Statistics Remove Visualization
article thumbnail

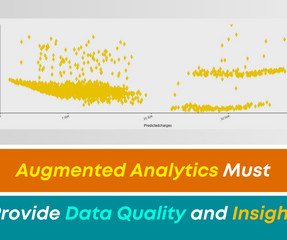
Augmented Analytics Must Provide Data Quality and Insight!

Smarten

What you need are apps and solutions that allow you to ask easy questions in your own words and receive guidance and recommendations on how to best visualize and present your data and what techniques to use to gain the most insight. These measures empower them with a deeper understanding of their data like never before.

article thumbnail

A Guide To The Methods, Benefits & Problems of The Interpretation of Data

datapine

Through the art of streamlined visual communication, data dashboards permit businesses to engage in real-time and informed decision-making and are key instruments in data interpretation. Interval: a measurement scale where data is grouped into categories with orderly and equal distances between the categories.

Insiders

Sign Up for our Newsletter

This site is protected by reCAPTCHA and the Google Privacy Policy and Terms of Service apply.

Trending Sources

article thumbnail

Visualize data quality scores and metrics generated by AWS Glue Data Quality

AWS Big Data

AWS Glue Data Quality allows you to measure and monitor the quality of data in your data repositories. An operational scorecard is a mechanism used to evaluate and measure the quality of data processed and validated by AWS Glue Data Quality rulesets. The crawler builds a Data Catalog, so the data can be queried using Athena.

article thumbnail

A Guide To Starting A Career In Business Intelligence & The BI Skills You Need

datapine

For example, if you enjoy computer science, programming, and data but are too extroverted to program all day long, you could work in a more human-oriented area of intelligence for business, perhaps involving more face-to-face interactions than most programmers would encounter on the job.

article thumbnail

Your Data Won’t Speak Unless You Ask It The Right Data Analysis Questions

datapine

Once you have your data analytics questions, you need to have some standard KPIs that you can use to measure them. OK – so far, you’ve picked out some data analysis questions, and you’ve found KPIs to measure them. There are basically 4 types of scales: *Statistics Level Measurement Table*. Did the best according to what?

IT 317
article thumbnail

How Good Leaders Keep Data in Perspective

Smart Data Collective

With better benchmarks, KPIs, and statistics , business leaders can better understand their environments and ultimately make more objective, logical decisions. Simply having a graph in front of you isn’t what enables you to make better business decisions; instead, it’s your interactions with data that really matter.

article thumbnail

The top 15 big data and data analytics certifications

CIO Business Intelligence

Certifications measure your knowledge and skills against industry- and vendor-specific benchmarks to prove to employers that you have the right skillset. Candidates show facility with data concepts and environments; data mining; data analysis; data governance, quality, and controls; and visualization.

Big Data 126