
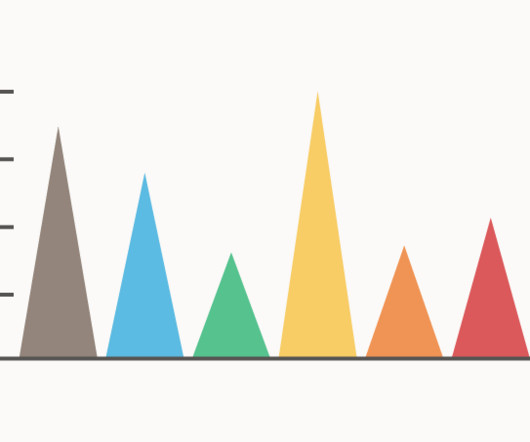
Chart Snapshot: Triangle Bar Charts
The Data Visualisation Catalogue
MARCH 22, 2024
While the Triangle Bar Chart offers a visually distinct way to represent categorical data, there are some considerations to keep in mind. The Visual Agency Related posts: Further Exploration #11: Bar/Column Chart Variations The post Chart Snapshot: Triangle Bar Charts appeared first on The Data Visualisation Catalogue Blog.


Let's personalize your content