

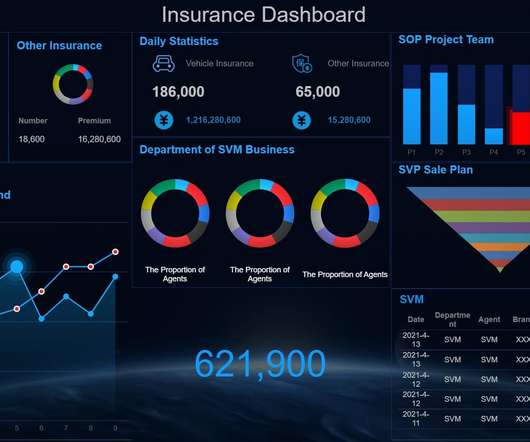
What is IoT Dashboard?
FineReport
JUNE 29, 2023
The Internet of Things (IoT) has revolutionized the way we interact with devices and gather data. Among the tools that have emerged from this digital transformation, IoT dashboards stand out as invaluable assets. IoT dashboards What is IoT Dashboard?


Let's personalize your content