article thumbnail

eCommerce Brands Use Data Analytics for Conversion Rate Optimization

Smart Data Collective

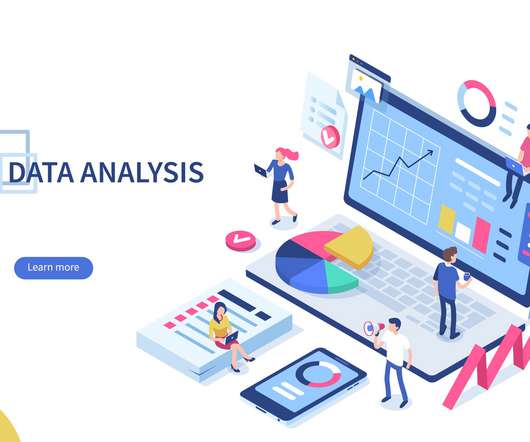
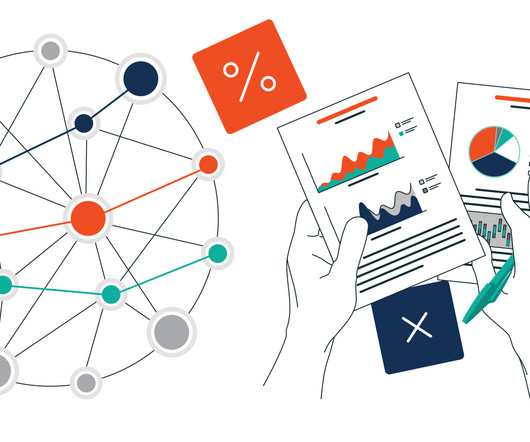
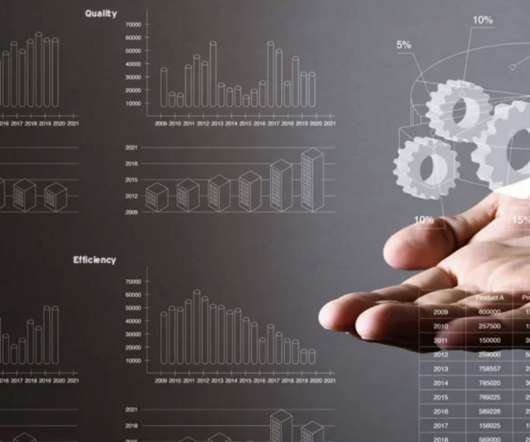
One benefit is that they can help with conversion rate optimization. Collecting Relevant Data for Conversion Rate Optimization Here is some vital data that e-commerce businesses need to collect to improve their conversion rates. Heatmaps are powerful visual tools help show where website visitors pay the most attention.

article thumbnail

12 data science certifications that will pay off

CIO Business Intelligence

The certification consists of several exams that cover topics such as machine learning, natural language processing, computer vision, and model forecasting and optimization. You should also have experience with pattern detection, experimentation in business optimization techniques, and time-series forecasting.

Insiders

Sign Up for our Newsletter

This site is protected by reCAPTCHA and the Google Privacy Policy and Terms of Service apply.

article thumbnail

Towards optimal experimentation in online systems

The Unofficial Google Data Science Blog

If the relationship of $X$ to $Y$ can be approximated as quadratic (or any polynomial), the objective and constraints as linear in $Y$, then there is a way to express the optimization as a quadratically constrained quadratic program (QCQP). However, joint optimization is possible by increasing both $x_1$ and $x_2$ at the same time.

article thumbnail

The top 15 big data and data analytics certifications

CIO Business Intelligence

Candidates are required to complete a minimum of 12 credits, including four required courses: Algorithms for Data Science, Probability and Statistics for Data Science, Machine Learning for Data Science, and Exploratory Data Analysis and Visualization. The online program includes an additional nonrefundable technology fee of US$395 per course.

Big Data 126
article thumbnail

Top 8 predictive analytics tools compared

CIO Business Intelligence

Most tools offer visual programming interfaces that enable users to drag and drop various icons optimized for data analysis. Visual IDE for data pipelines; RPA for rote tasks. The visual IDE offers more than 300 options that can be joined together to form a complex pipeline. Top predictive analytics tools compared.

article thumbnail

Ferrovial puts AI at the heart of its transformation

CIO Business Intelligence

With the aim to accelerate innovation and transform its digital infrastructures and services, Ferrovial created its Digital Hub to serve as a meeting point where research and experimentation with digital strategies could, for example, provide new sources of income and improve company operations.

IT 105
article thumbnail

How to get powerful and actionable insights from any and all of your data, without delay

Cloudera

By enabling their event analysts to monitor and analyze events in real time, as well as directly in their data visualization tool, and also rate and give feedback to the system interactively, they increased their data to insight productivity by a factor of 10. . Our solution: Cloudera Data Visualization. This led them to fall behind.