
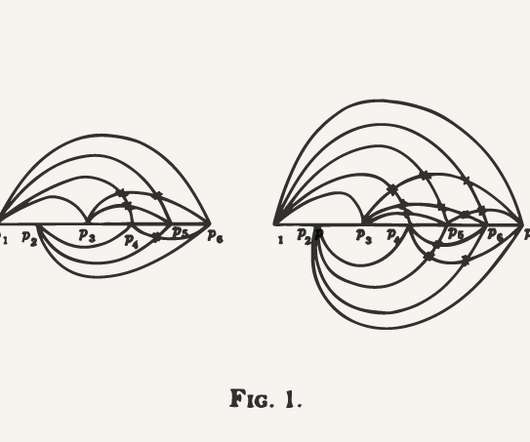
Academic Research Done on Arc Diagrams
The Data Visualisation Catalogue
FEBRUARY 11, 2022
Visualising Bluetooth Interactions (2007) By Daragh Byrne, Barry Lavelle, Gareth J.F. Designed in this paper is a visualisation that combines Arc Diagrams with the DocuBurst technique to convey a rich understanding of Bluetooth interaction data. Achieving Good Angular Resolution in 3D Arc Diagram (2013) By Michael T.


Let's personalize your content